-
Notifications
You must be signed in to change notification settings - Fork 0
Unsupervised ML: Clustering Algorithms
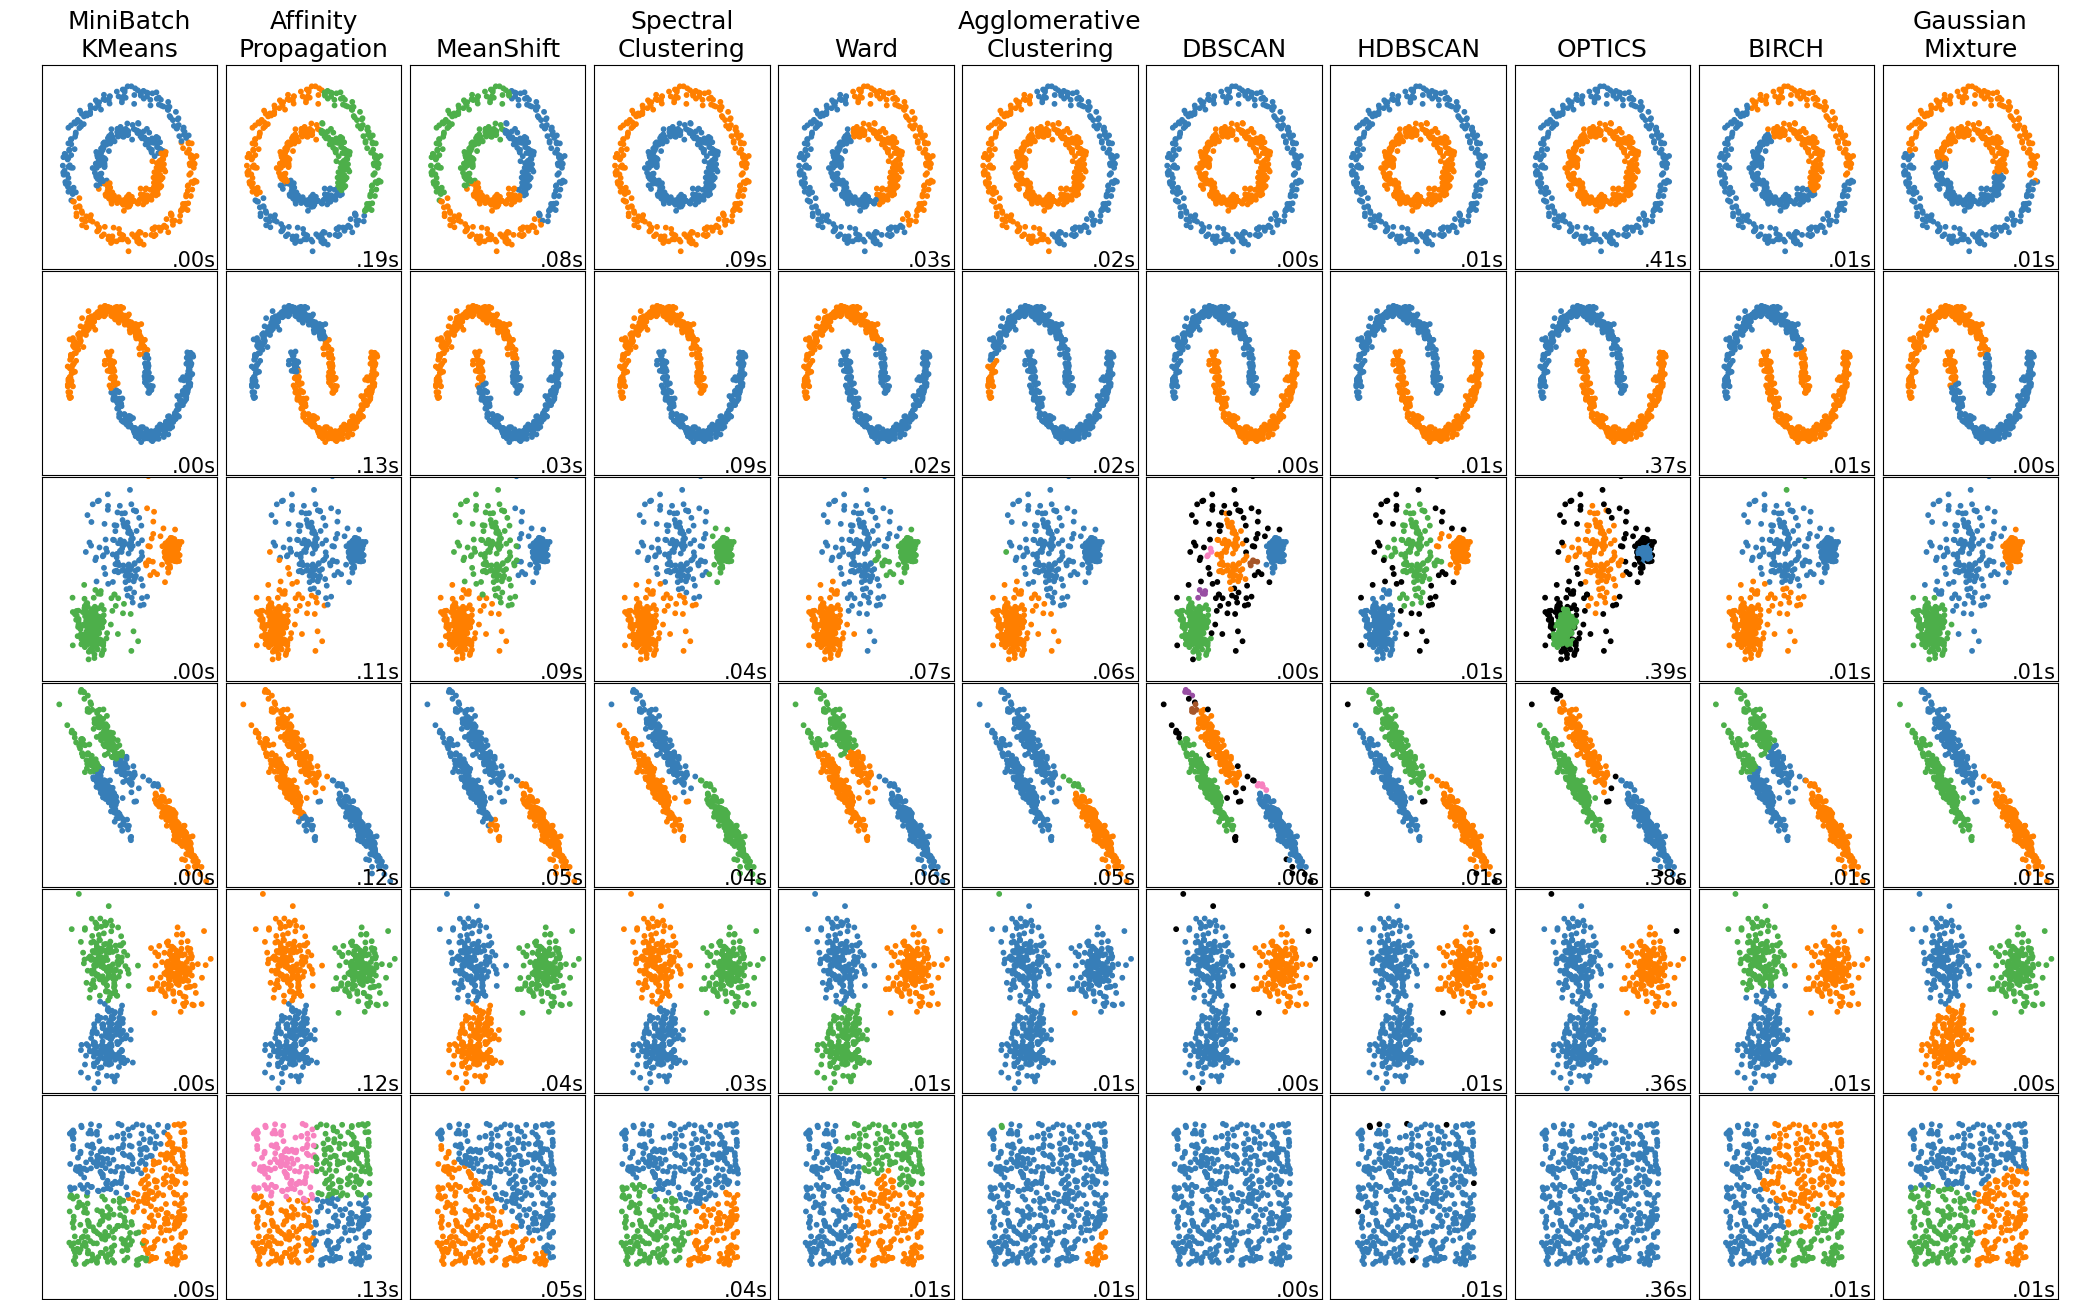
Clustering is a technique used in classical machine learning to group similar data points together into clusters, based on the similarity of their features. It is an unsupervised learning technique, which means that it does not rely on labeled data for training, but rather on the inherent patterns and similarities within the data itself.
The goal of clustering is to identify groups of data points that are similar to each other, while also being dissimilar to data points in other groups. This can be useful for many different applications, such as market segmentation, image segmentation, anomaly detection, and more.
Scikit-learn includes several clustering algorithms for unsupervised learning. Here are some of the main clustering algorithms available in scikit-learn:
- K-means: This is a widely used algorithm for clustering that aims to partition data into K clusters, where the user specifies K. This algorithm is widely used for image compression, market segmentation, and customer segmentation. For example, in image compression, the algorithm groups similar pixels together and represents them with the same color, reducing the number of colors needed to represent the image.

-
Mean Shift: This algorithm is similar to K-Means, but it does not require the user to specify the number of clusters. It starts with an initial estimate of the cluster centers and shifts the centers toward the densest areas of the data.
-
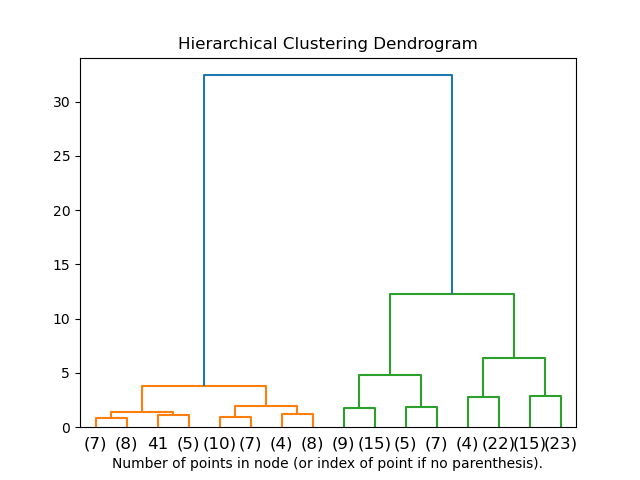
Hierarchical clustering: This algorithm builds a hierarchy of clusters by either merging smaller clusters or dividing larger ones. It can be agglomerative or divisive. This algorithm is useful for gene expression analysis, document clustering, and image segmentation. For example, in gene expression analysis, the algorithm can be used to group genes based on their expression patterns, which can help identify patterns and relationships among genes.
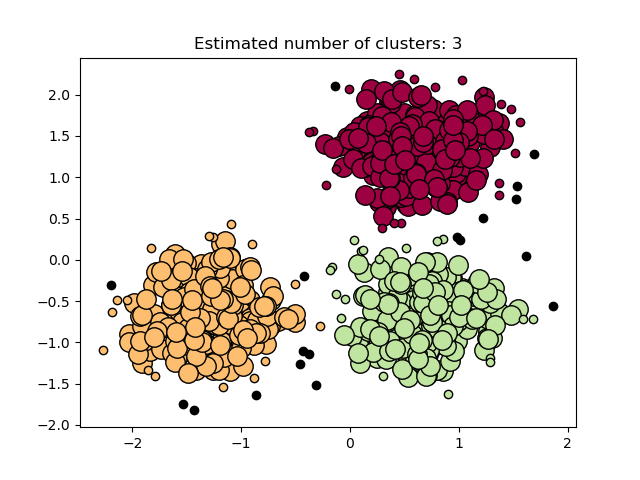
- DBSCAN: This algorithm groups together data points that are closely packed together, and it can detect outliers that do not belong to any cluster. This algorithm is useful for anomaly detection, fraud detection, and outlier detection. For example, in fraud detection, the algorithm can identify transactions that are significantly different from other transactions and are therefore more likely to be fraudulent.
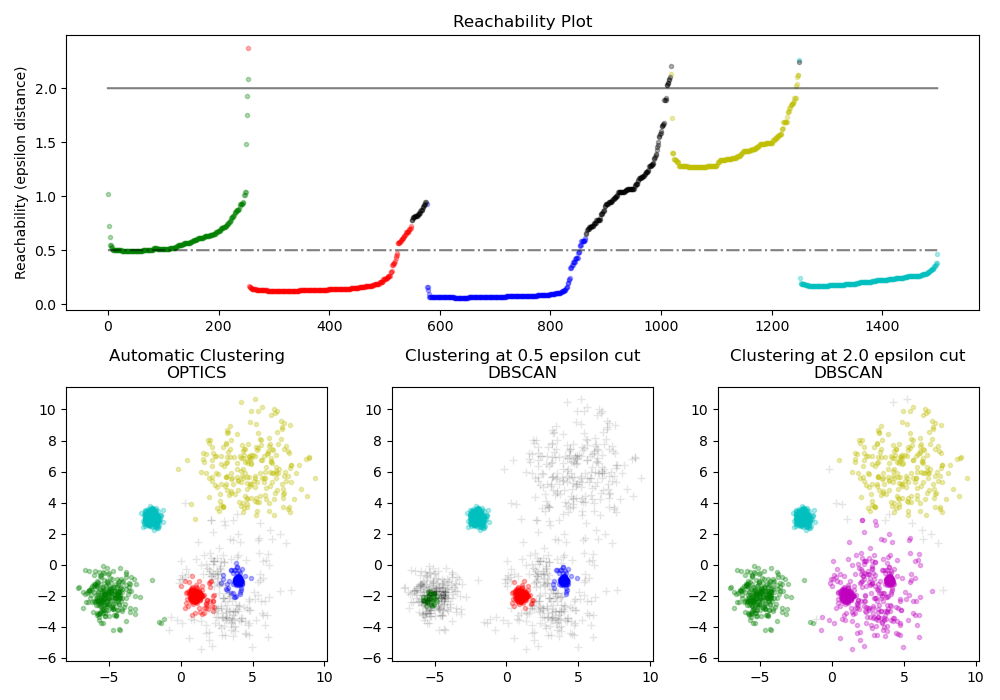
- The OPTICS: This algorithm shares many similarities with the DBSCAN algorithm and can be considered a generalization of DBSCAN that relaxes the eps (density threshold parameter) requirement from a single value to a value range. One example of an application of the OPTICS clustering algorithm is in spatial data analysis. Spatial data analysis involves analyzing data with a geographical component, such as data collected from GPS devices or satellite imagery. In this context, the OPTICS algorithm can be used to identify clusters of data points close to each other in space.
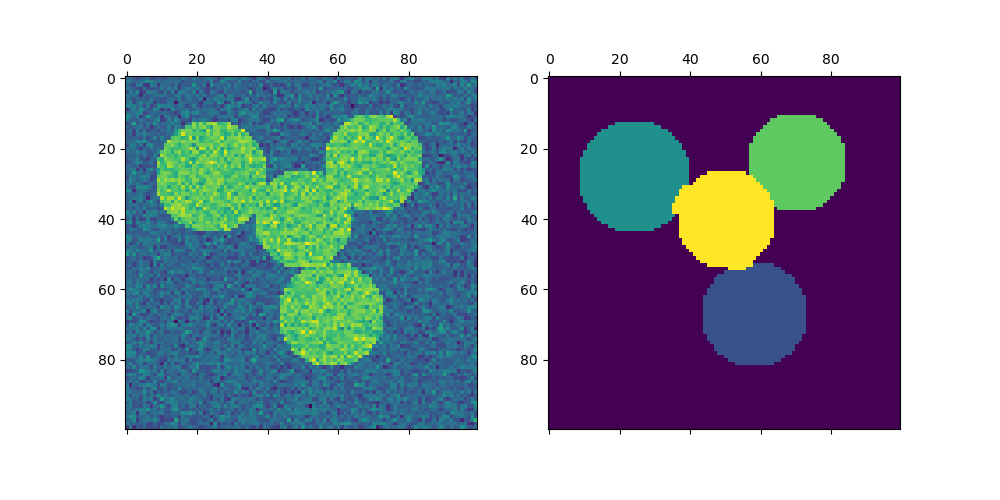
- Spectral clustering: This algorithm uses the eigenvectors of the similarity matrix to cluster data points, and it can handle non-linearly separable data. This algorithm is useful for community detection in social networks, image segmentation, and object recognition. For example, in object recognition, the algorithm can group pixels that belong to the same object, making it easier to identify and track objects in videos.
The present version of SpectralClustering requires the number of clusters to be specified in advance. It works well for a small number of clusters but is not advised for many clusters.
-
Gaussian mixture models (GMM): This algorithm models the data as a mixture of Gaussian distributions, and it can be used for density estimation and clustering. This algorithm is useful for image segmentation, speech recognition, and clustering of financial data. For example, in financial data clustering, the algorithm can identify groups of stocks with similar characteristics, which can help investors make more informed decisions.
-
Birch: This is a memory-efficient clustering algorithm that can scale well to large datasets, and it creates a hierarchical clustering structure.
These are just a few of the clustering algorithms available in scikit-learn. The choice of algorithm depends on the specific problem at hand and the nature of the data being clustered.
Using Scikit-learn clustering algorithms:
-
K-means
from sklearn.cluster import KMeans -
Mean shift
from sklearn.cluster import MeanShift -
Spectral clustering
from sklearn.cluster import SpectralClustering -
DBSCAN
from sklearn.cluster import DBSCAN -
OPTICS
from sklearn.cluster import OPTICS -
Gaussian Mixture
from sklearn.mixture import GaussianMixture -
BIRCH
from sklearn.cluster import Birch
Please see Jupyter Notebook Example
The sklearn.metrics.cluster submodule contains evaluation metrics for cluster analysis results. There are two forms of evaluation:
- supervised, which uses ground truth class values for each sample.
- unsupervised, which does not measure the ‘quality’ of the model itself.
Different metrics can be used to evaluate clustering algorithms, including Silhouette score, Calinski-Harabasz score, and Davies-Bouldin index.
The choice of metric depends on the specific application, and it is often helpful to use multiple metrics to evaluate performance.
- Scikit-Learn Clustering Documentation
- Introduction to Machine Learning with Scikit-Learn. Carpentries lesson.
- 10 Clustering Algorithms With Python. Jason Brownlee. Machine Learning Mastery.
Created: 04/01/2023 (C. Lizárraga); Last update: 01/19/2023 (C. Lizárraga)
UArizona DataLab, Data Science Institute, 2024
