-
Notifications
You must be signed in to change notification settings - Fork 5
Projections
Ultraliser uses surface and solid voxelization [1, 2] to create large-scale volumes, with which we can reconstruct watertight surface meshes from non-watertight input meshes. In certain cases, we project the content of the intermediate volume grid along any of the axis to visualize its content and relate the results to the resulting mesh that is reconstructed at the final stage of the pipeline.
The current version of Ultraliser has support to export PPM images along the XY, XZ and ZY directions using the following command line arguments:
-
--project-xyAdding this argument to the command line will project the volume along the Z-axis and create a gray-scale PPM image. -
--project-xzAdding this argument to the command line will project the volume along the Y-axis and create a gray-scale PPM image. -
--project-zyAdding this argument to the command line will project the volume along the X-axis and create a gray-scale PPM image.
| Projection Plane | Projection Axis | Surface Voxelization | Solid Voxelization |
|---|---|---|---|
| XY | Z | 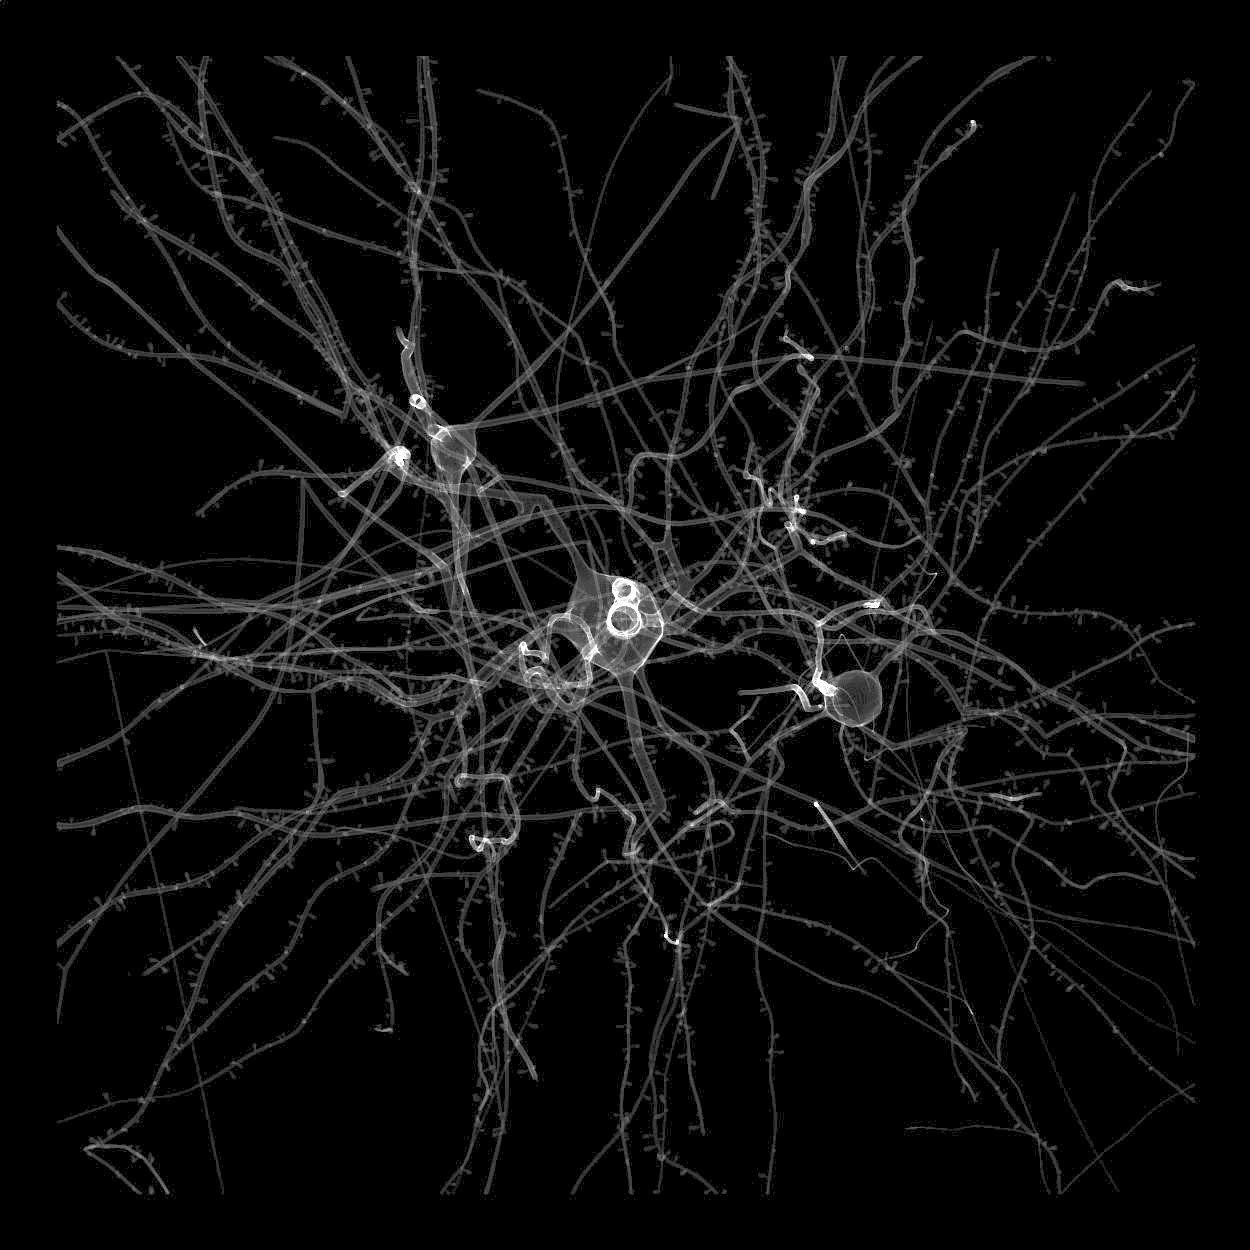 |
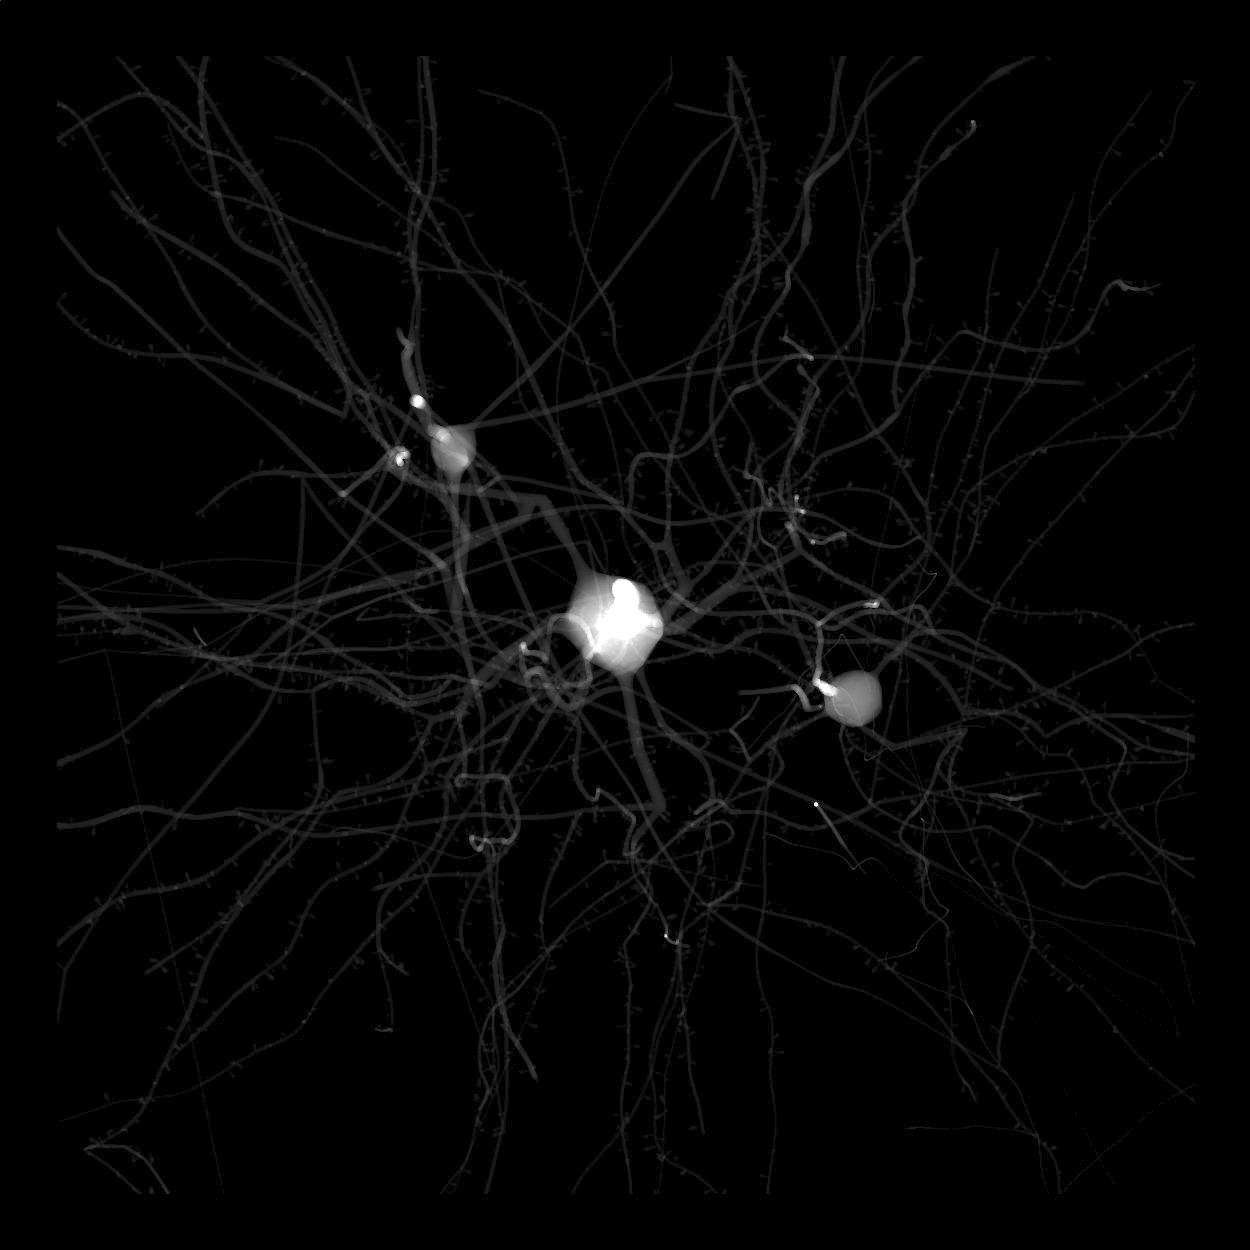 |
| ZY | X | 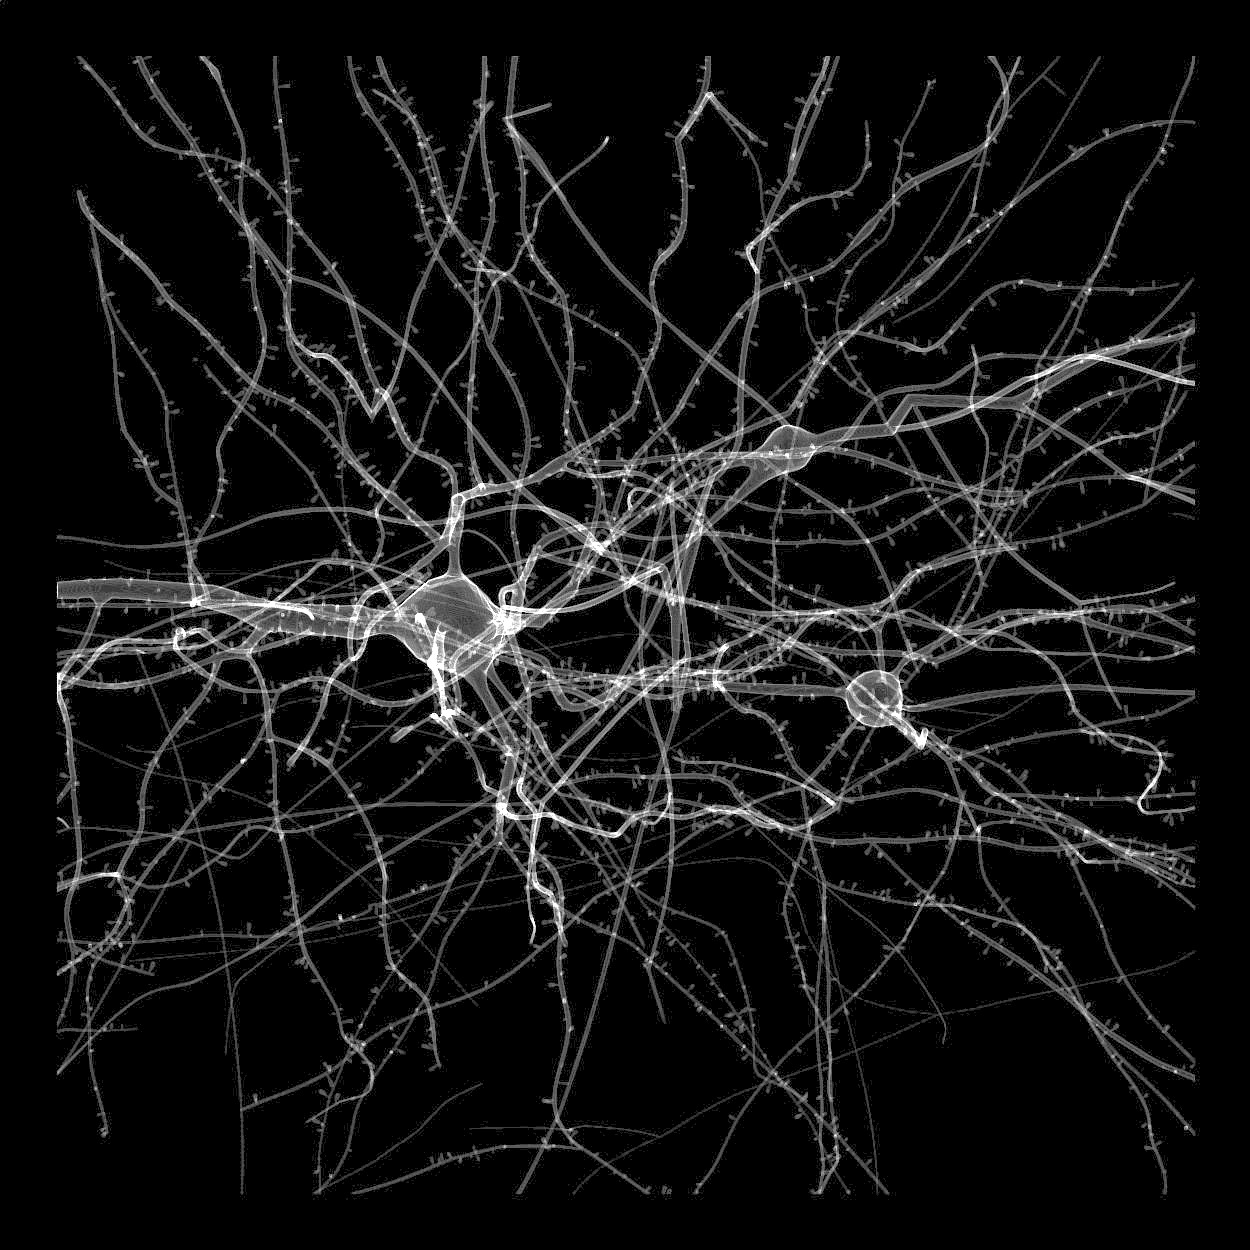 |
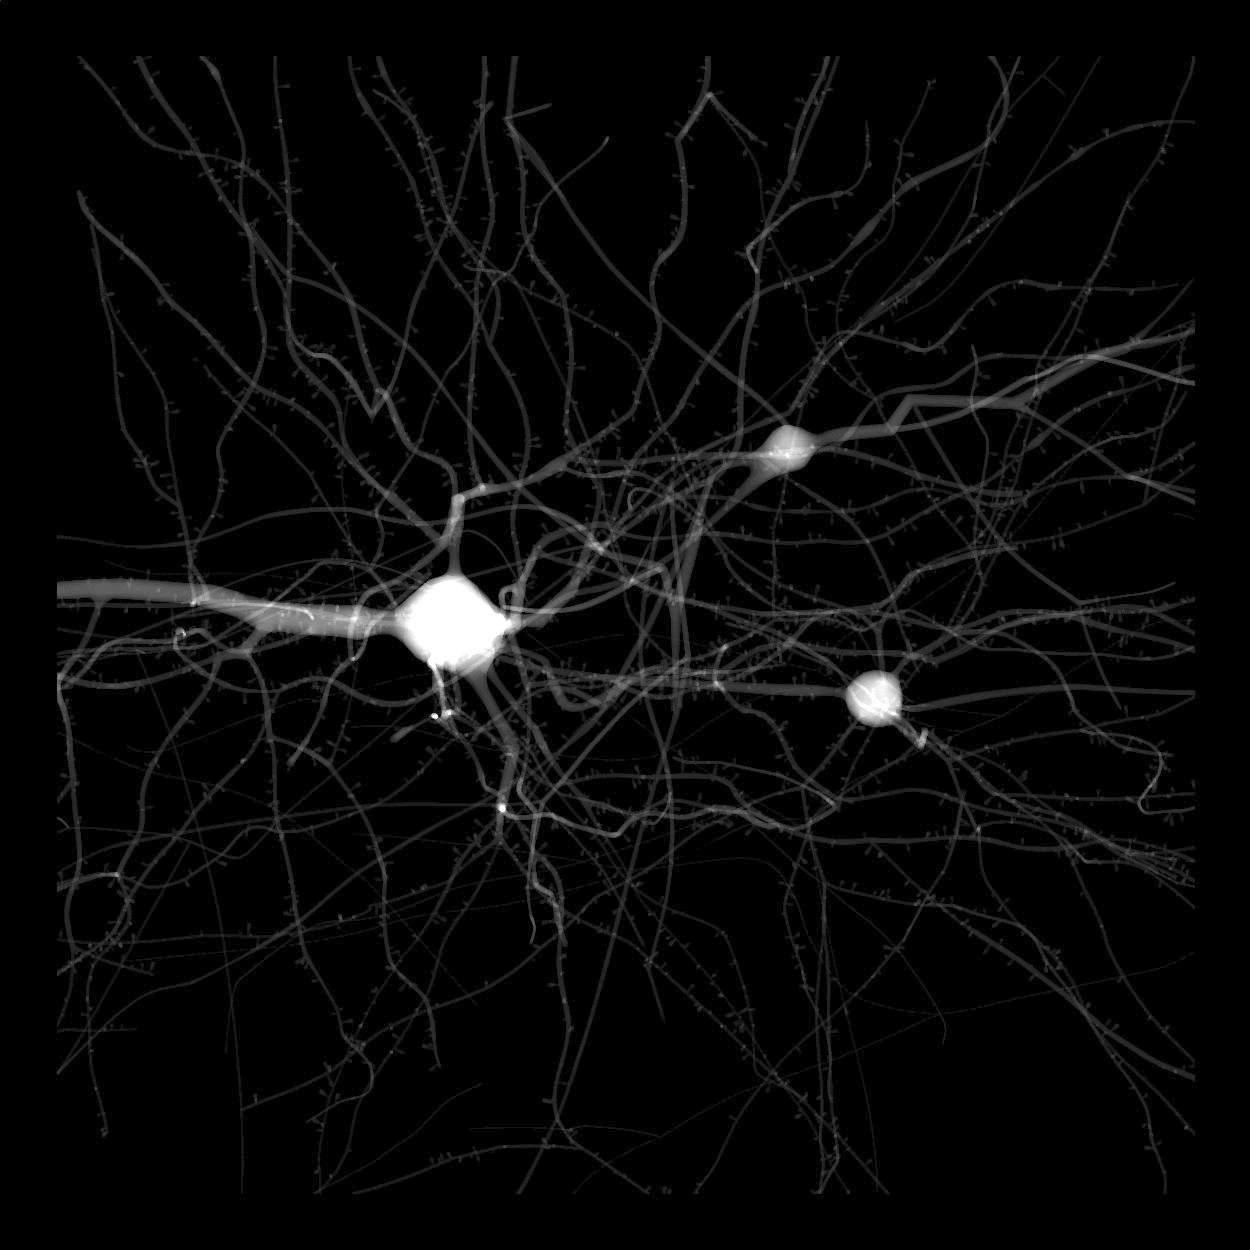 |
| XZ | Y |  |
 |
Ultraliser has support to create color-coded projections in different colormaps using the command line argument --project-color-coded. The colormaps are all inspired from matplotlib.
When the --project-color-coded option is added to the command line, each requested projections will be generated with the following colormaps:
| Colormap | XY Projection Image (Solid Voxelization) |
|---|---|
| VIRIDIS |  |
| PLASMA |  |
| INFERNO | 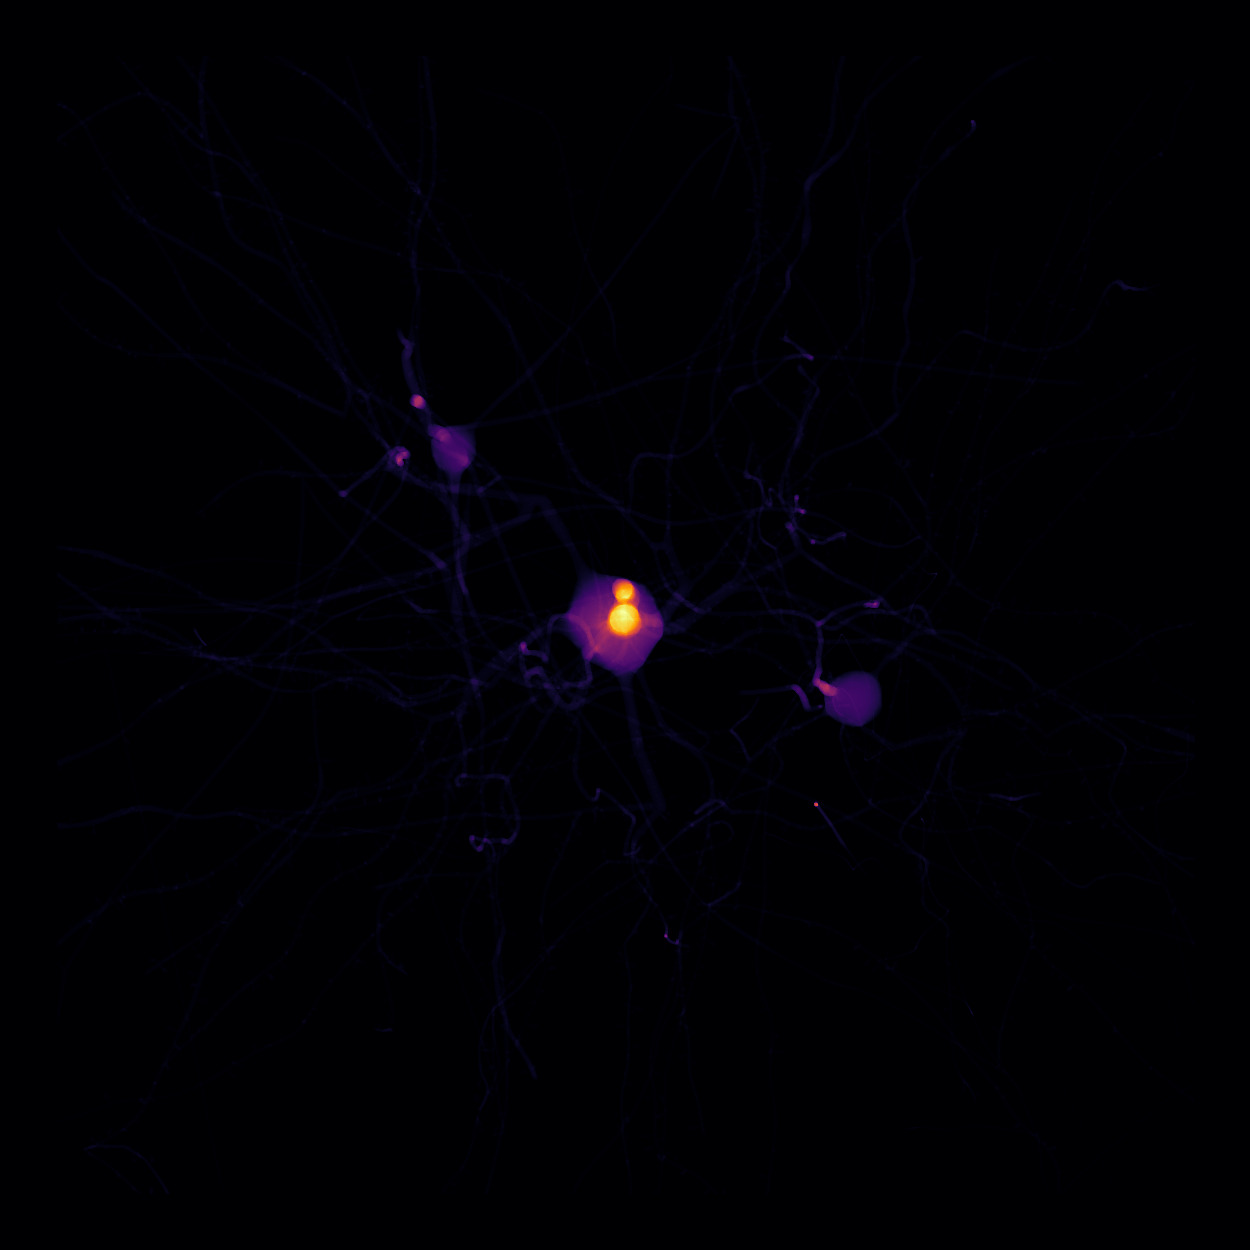 |
| MAGMA |  |
| CIVIDIS |  |
| GREYS |  |
| PURPLES |  |
| BLUES |  |
| GREENS | 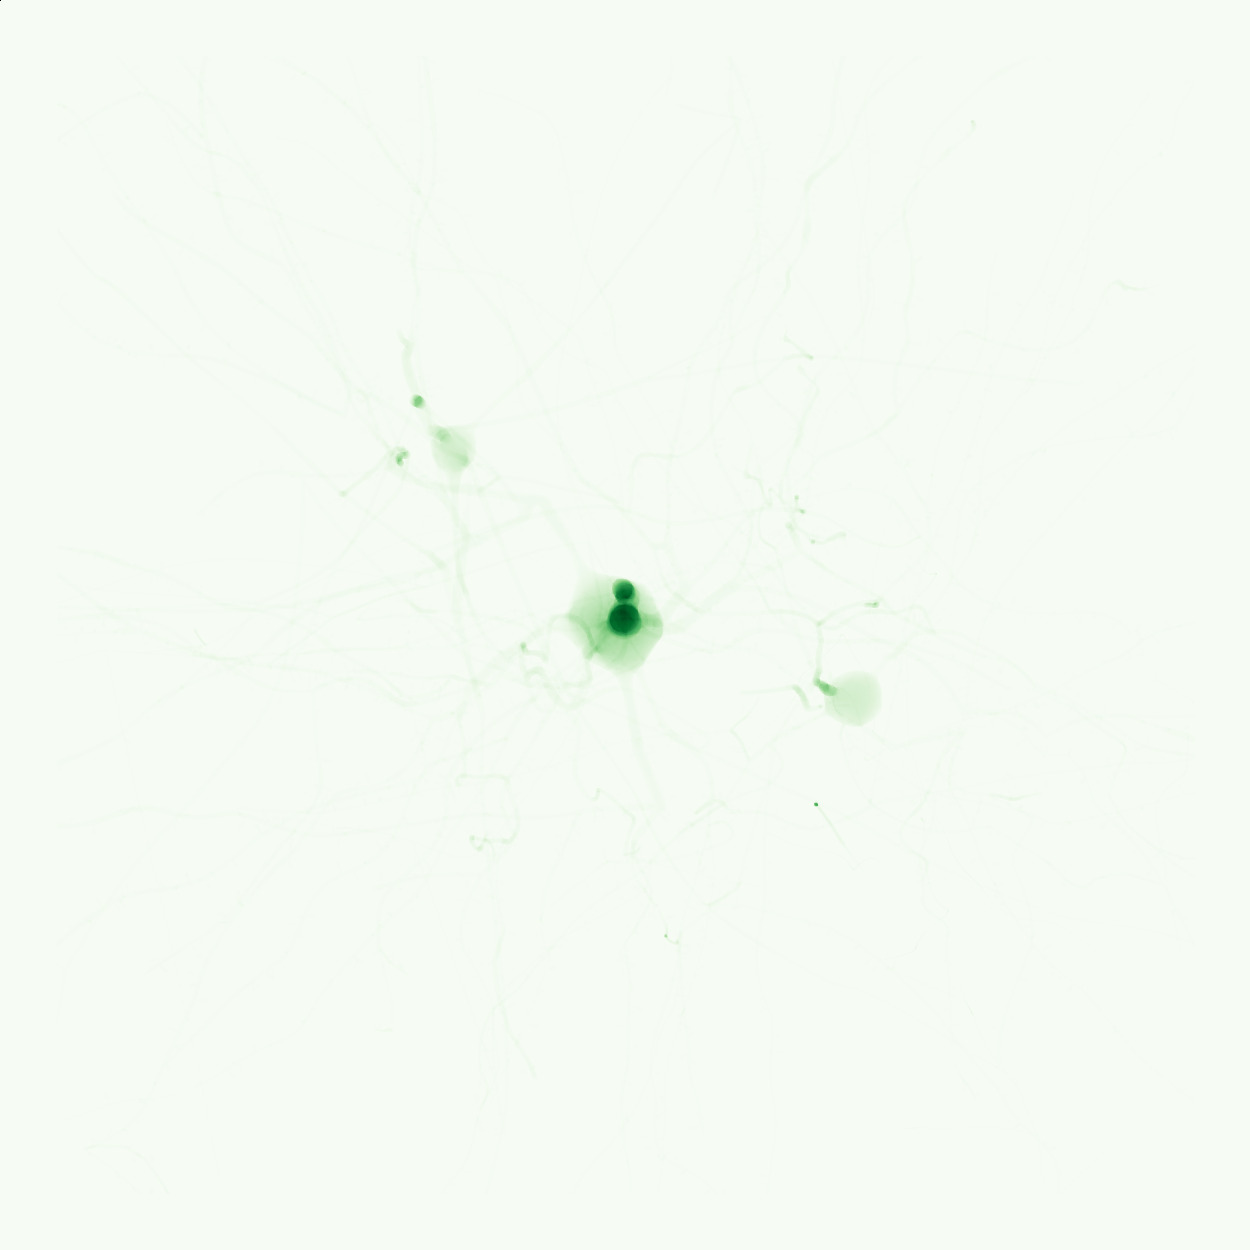 |
| ORANGES |  |
| REDS |  |
| YLORBR |  |
| YLORRD |  |
| ORRD |  |
| PURD |  |
| RDPU |  |
| BUPU | 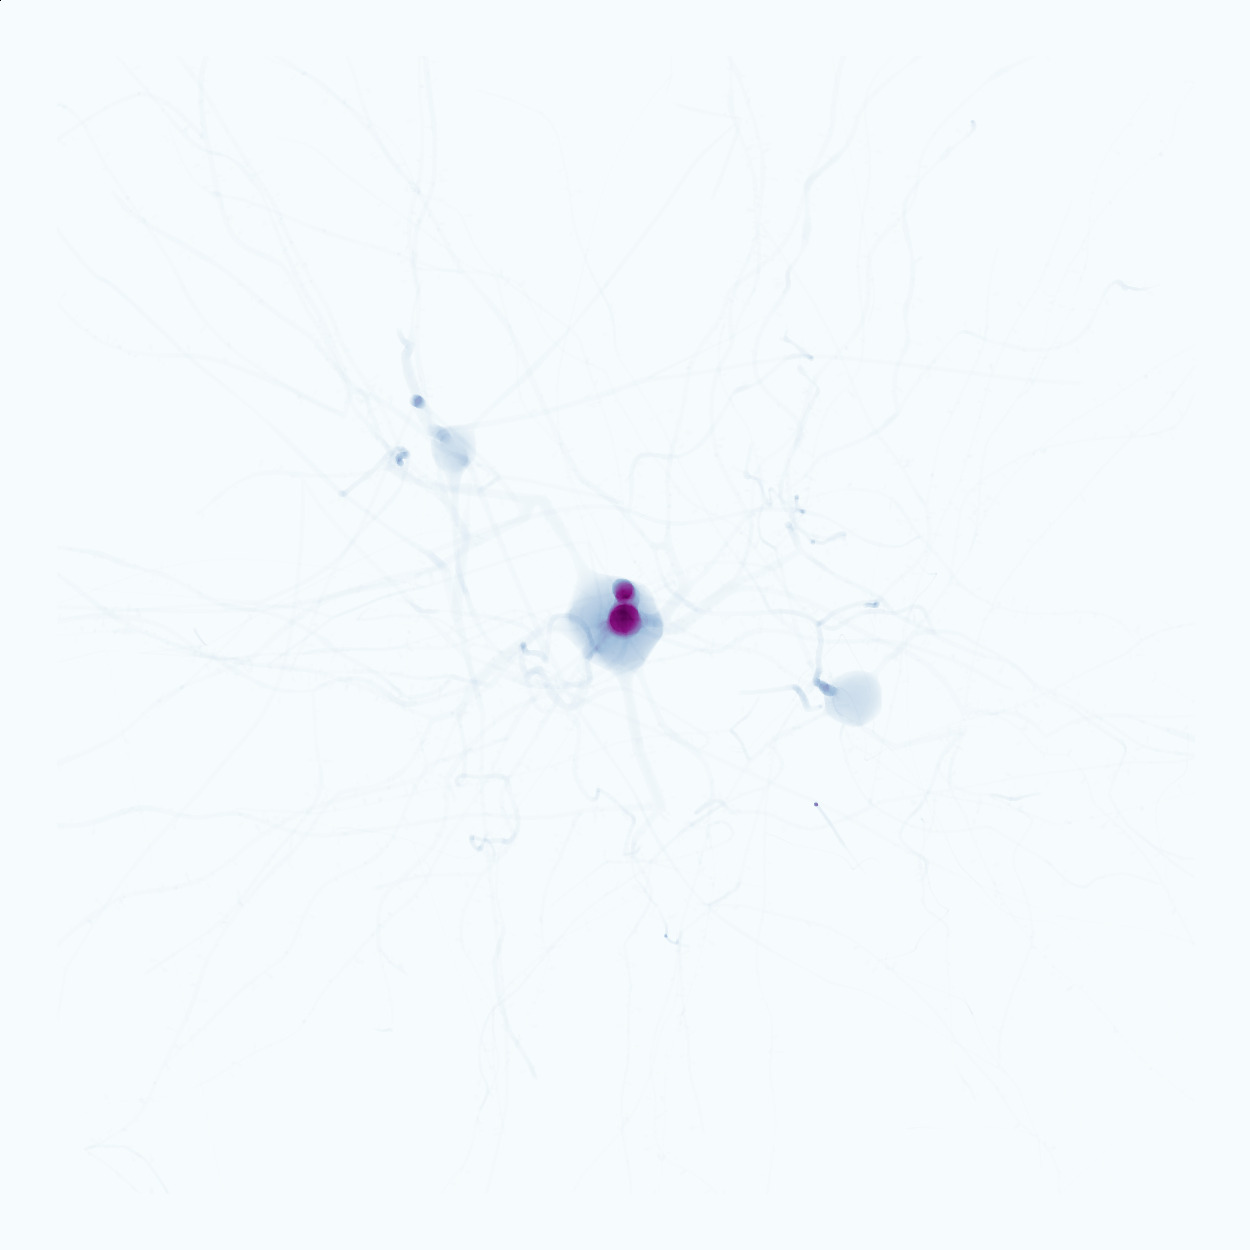 |
| GNBU |  |
| PUBU |  |
| YLGNBU |  |
| PUBUGN |  |
| BUGN | 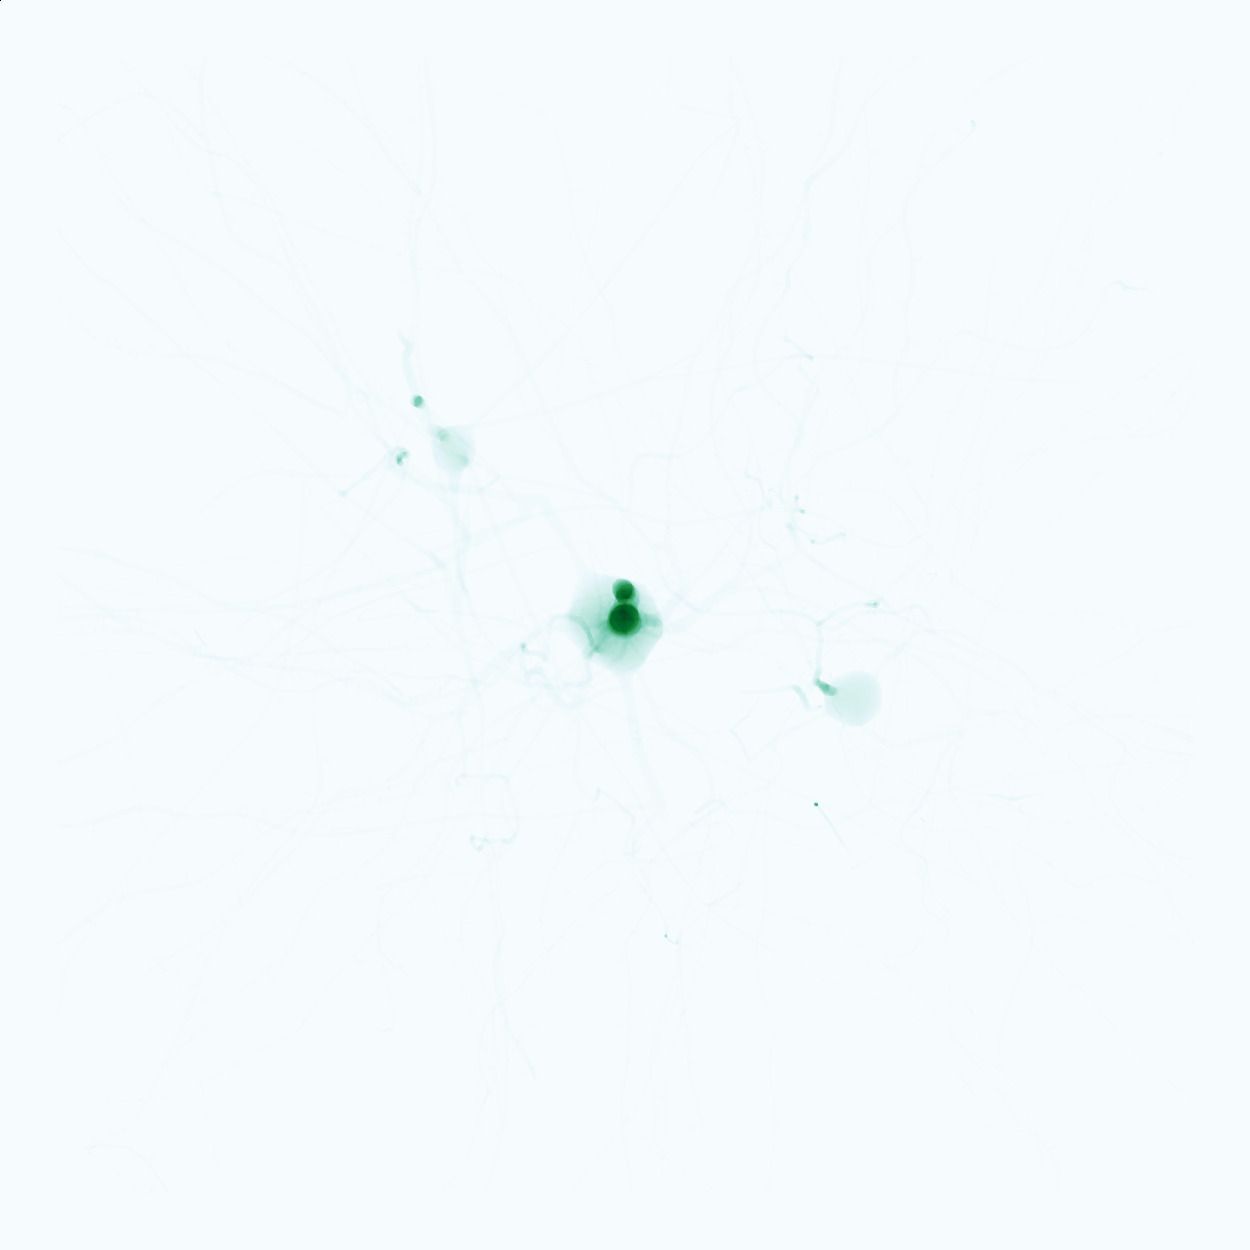 |
| YLGN |  |
| BINARY |  |
| GIST_YARG |  |
| GIST_GRAY |  |
| GRAY |  |
| BONE | 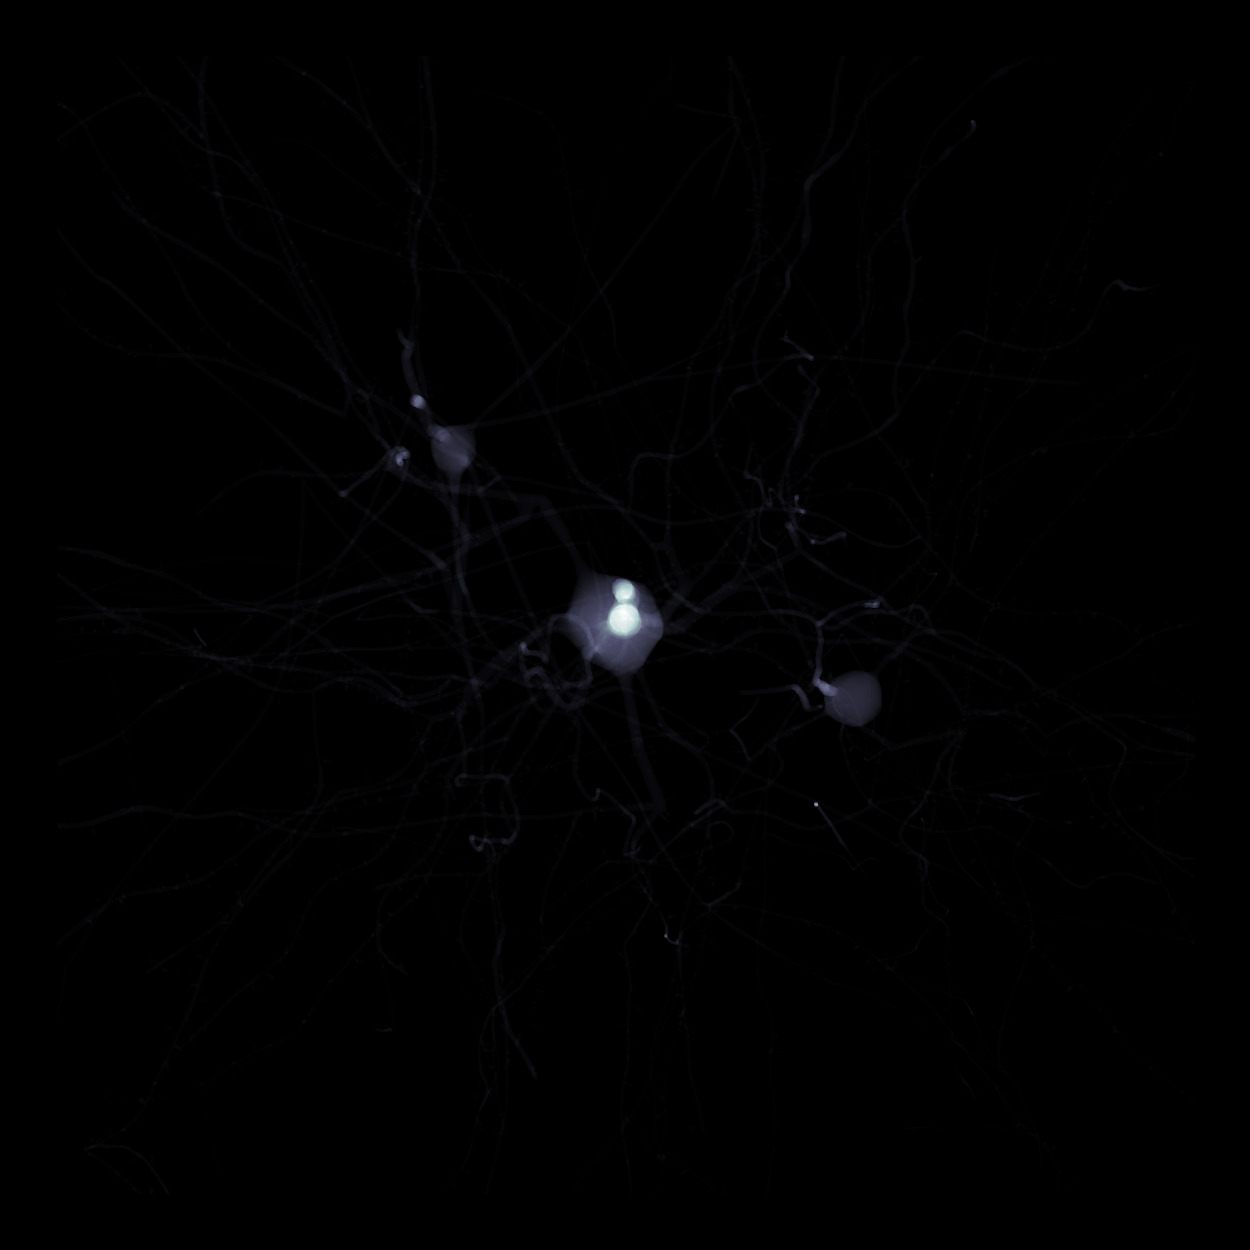 |
| PINK |  |
| SPRING |  |
| SUMMER |  |
| AUTUMN |  |
| WINTER |  |
| COOL |  |
| WISTIA |  |
| HOT |  |
| AFMHOT |  |
| GIST_HEAT |  |
| COPPER | 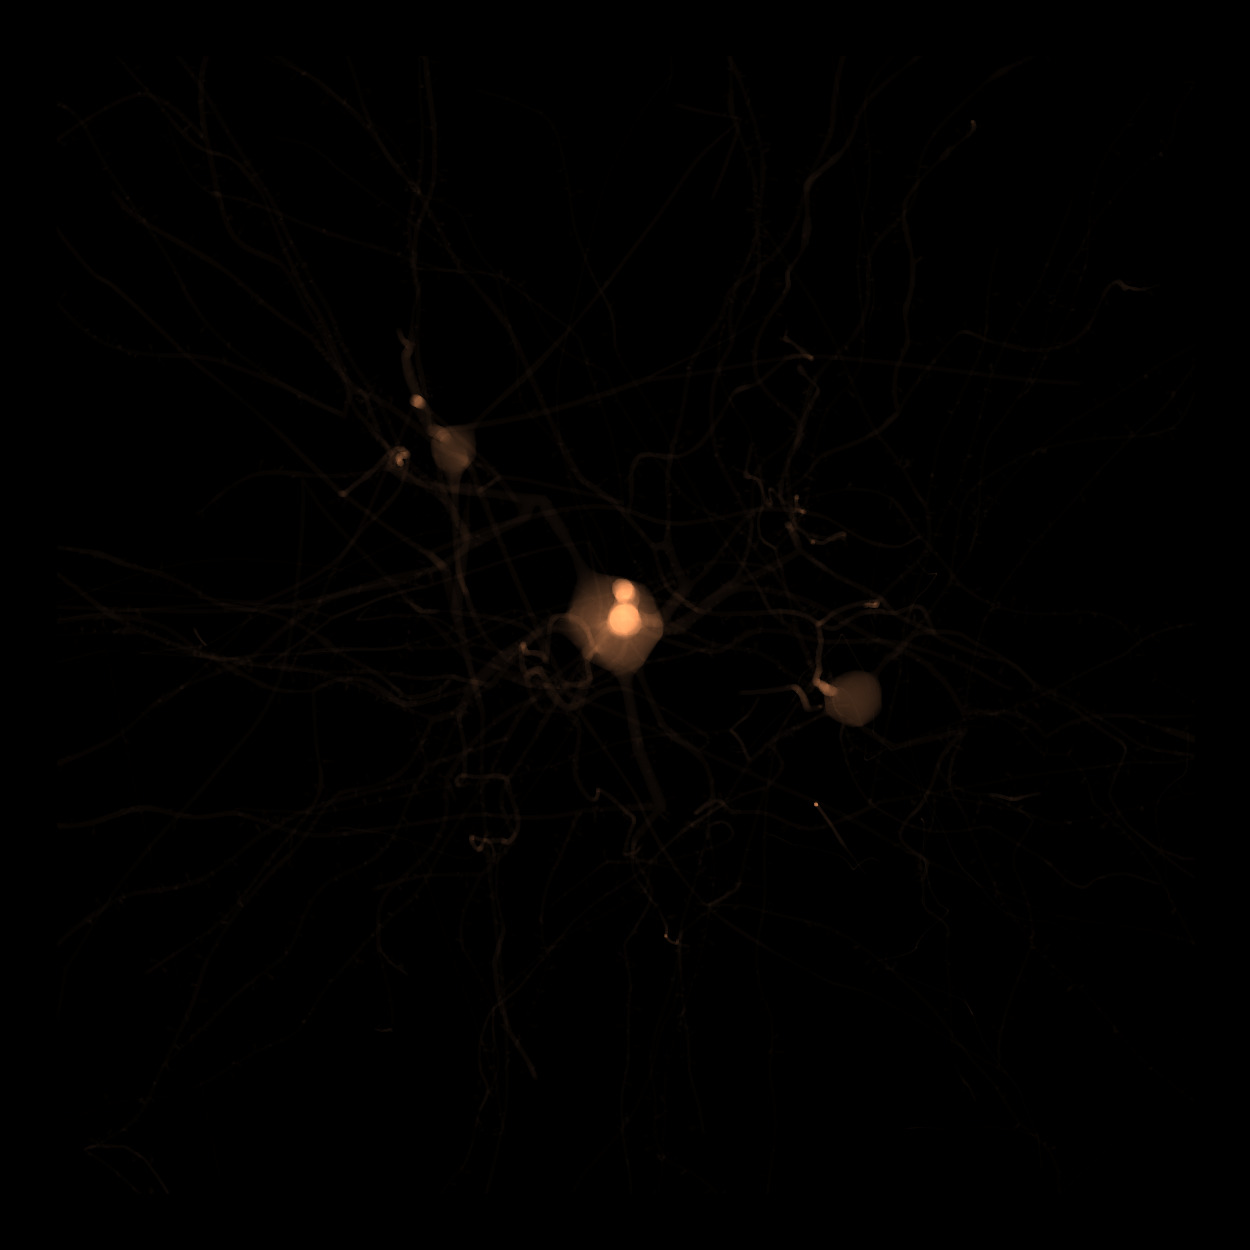 |
| PIYG | 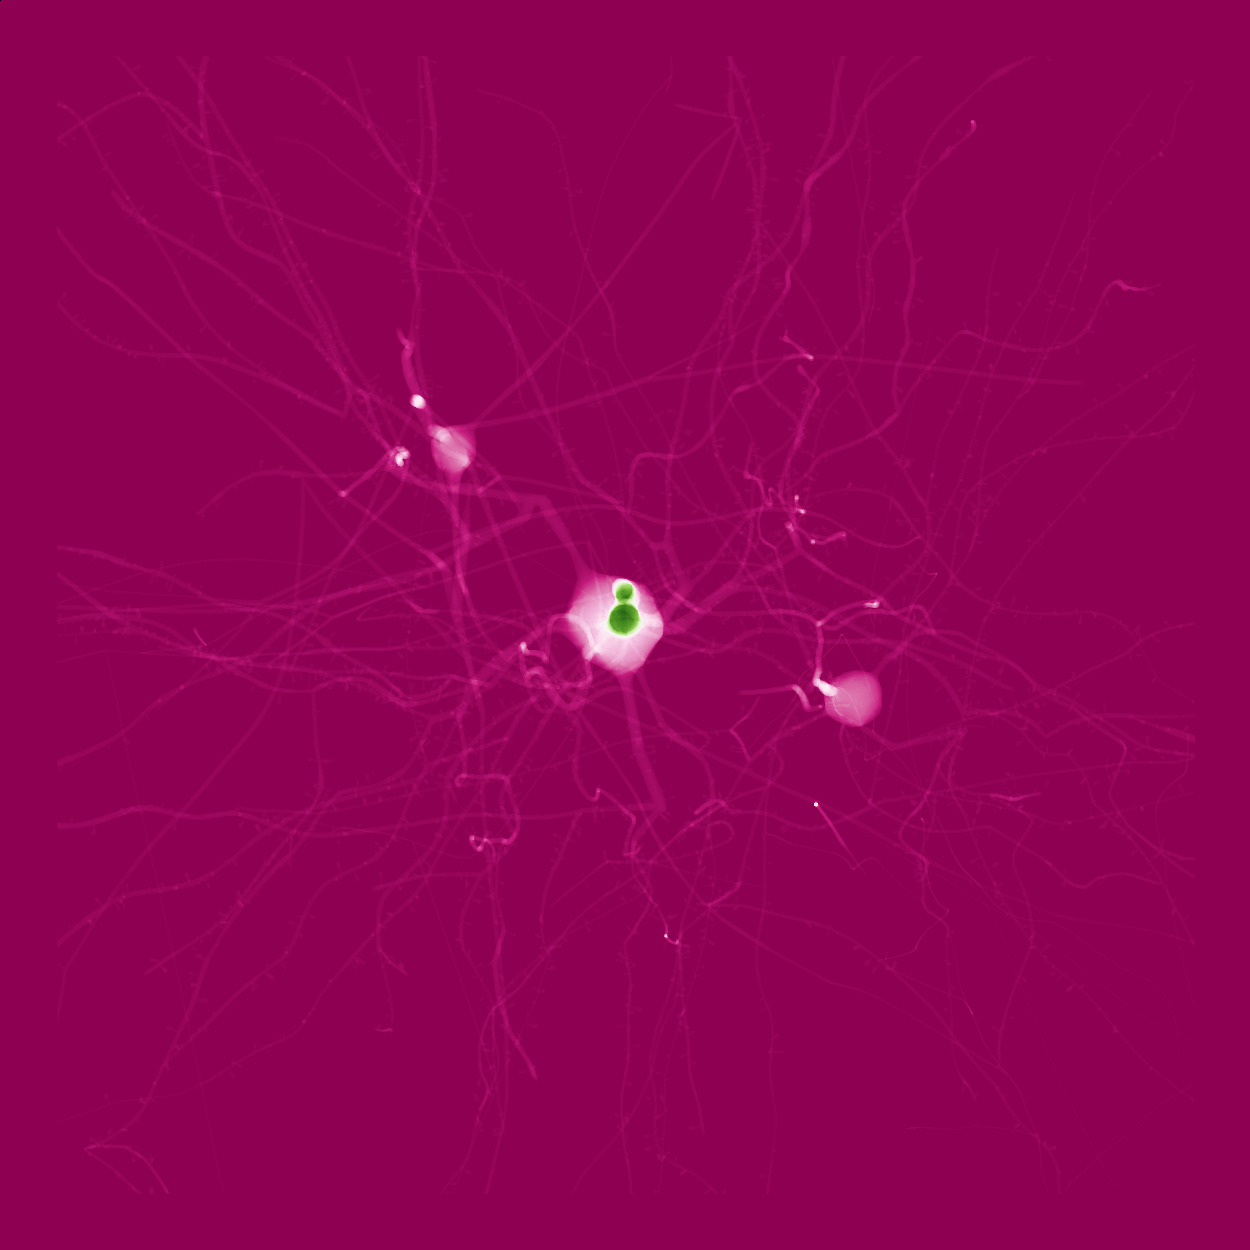 |
| PRGN |  |
| BRBG |  |
| PUOR |  |
| RDGY | 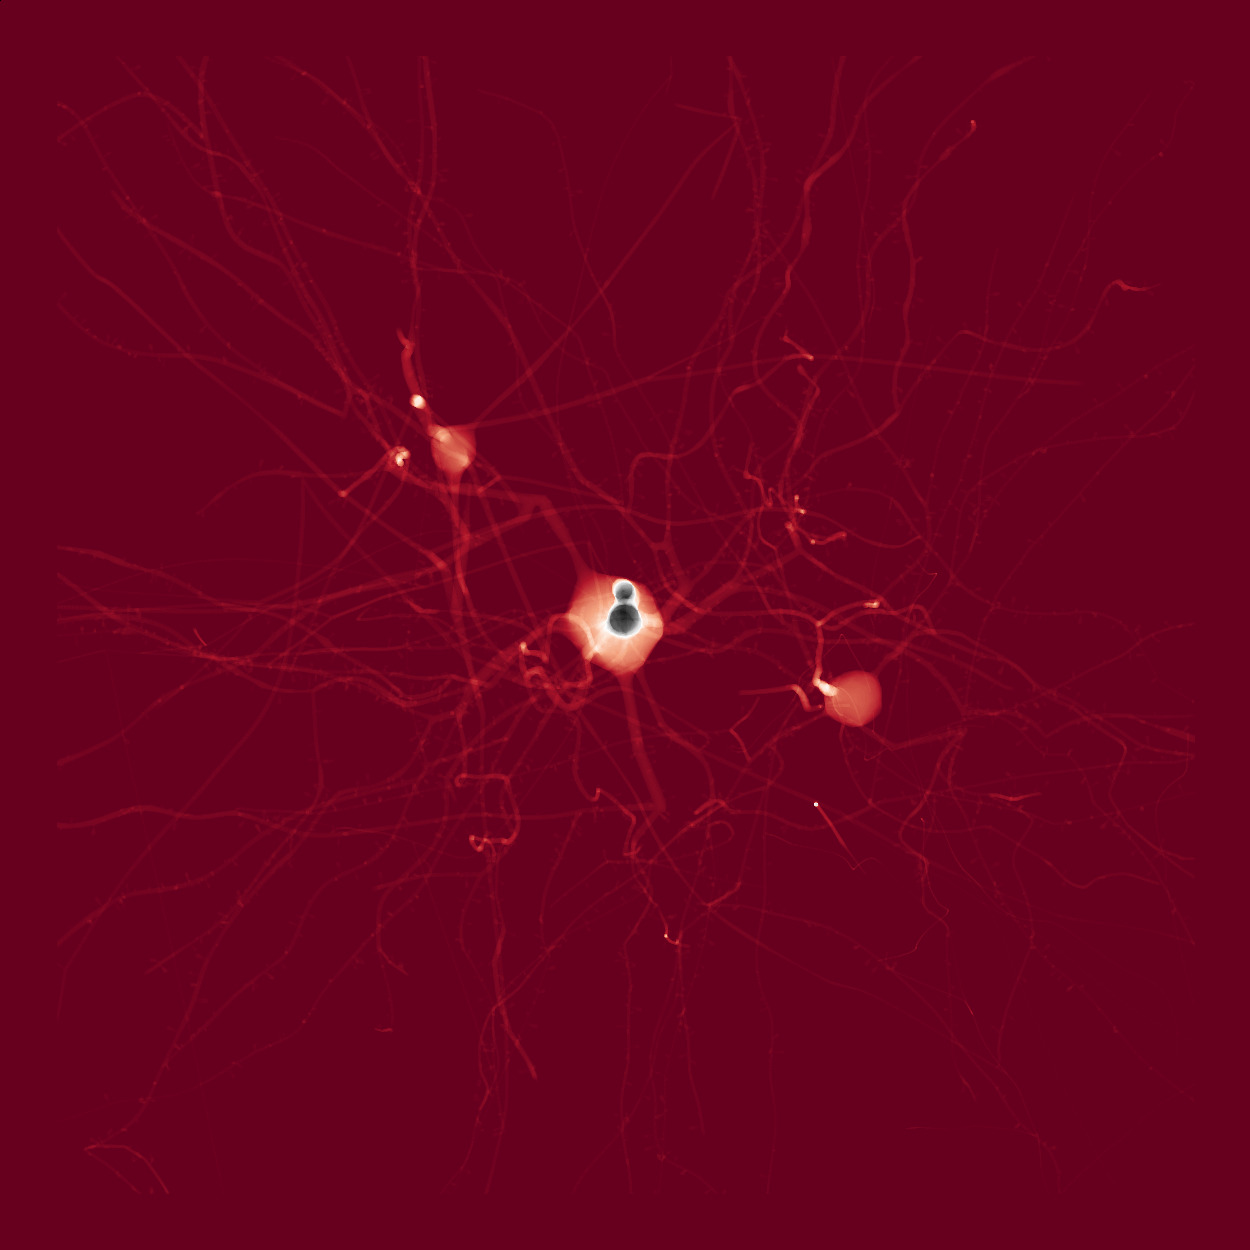 |
| RDBU |  |
| RDYLBU |  |
| RDYLGN |  |
| SPECTRAL | 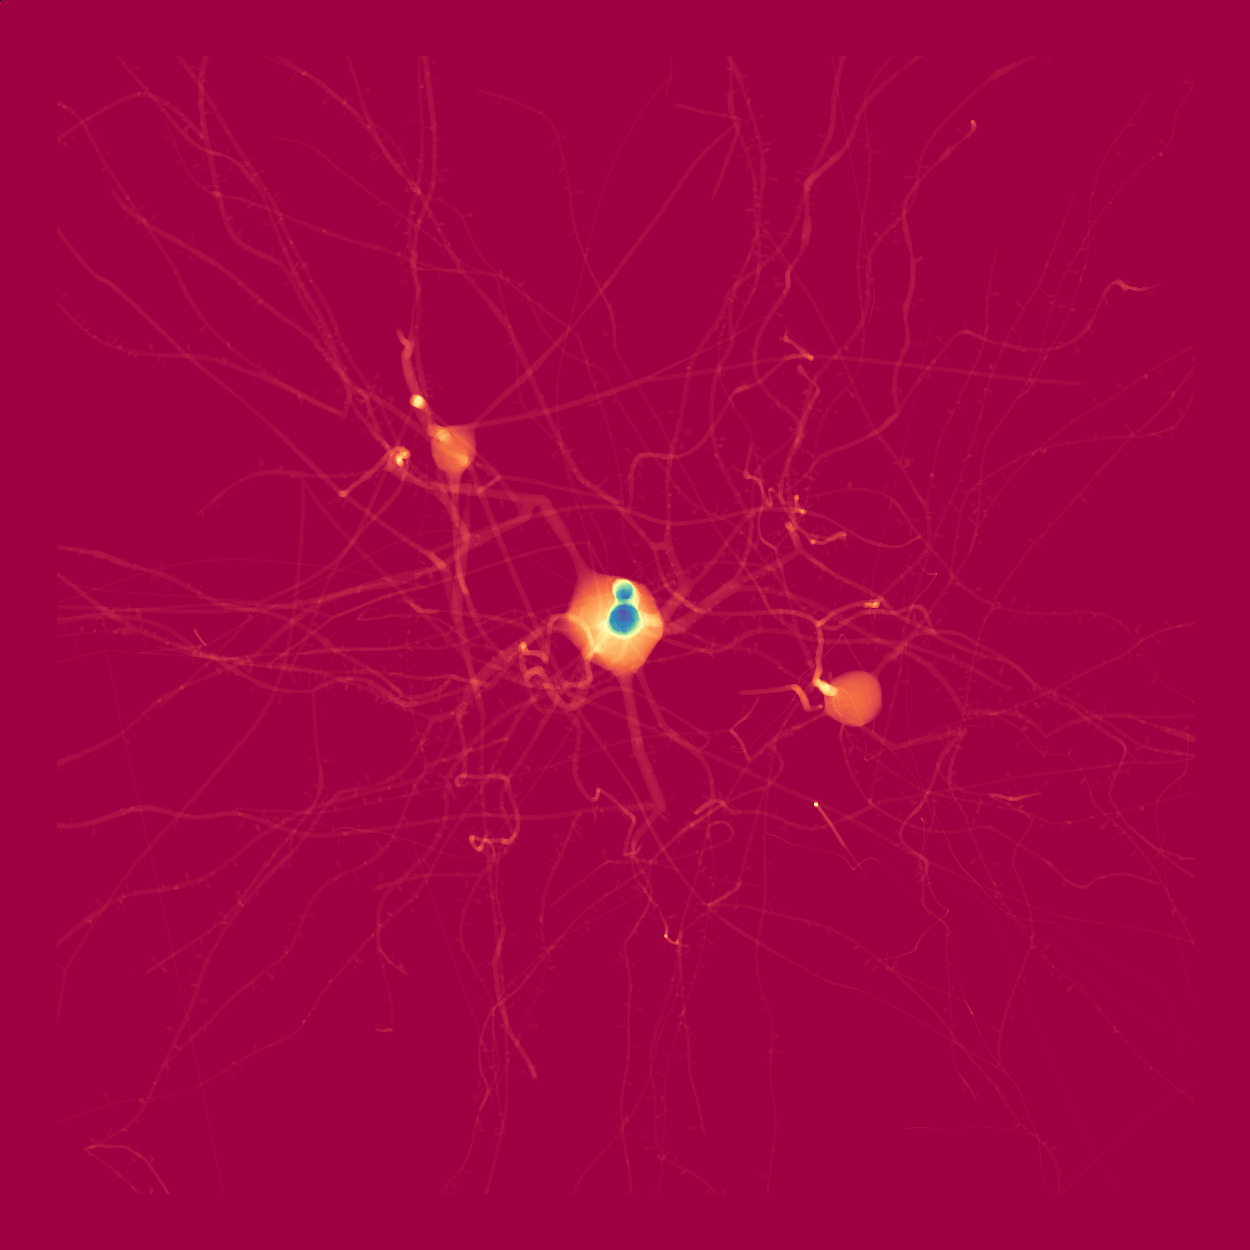 |
| COOLWARM |  |
| BWR |  |
| SEISMIC |  |
| TWILIGHT |  |
| TWILIGHT_SHIFTED |  |
| HSV | 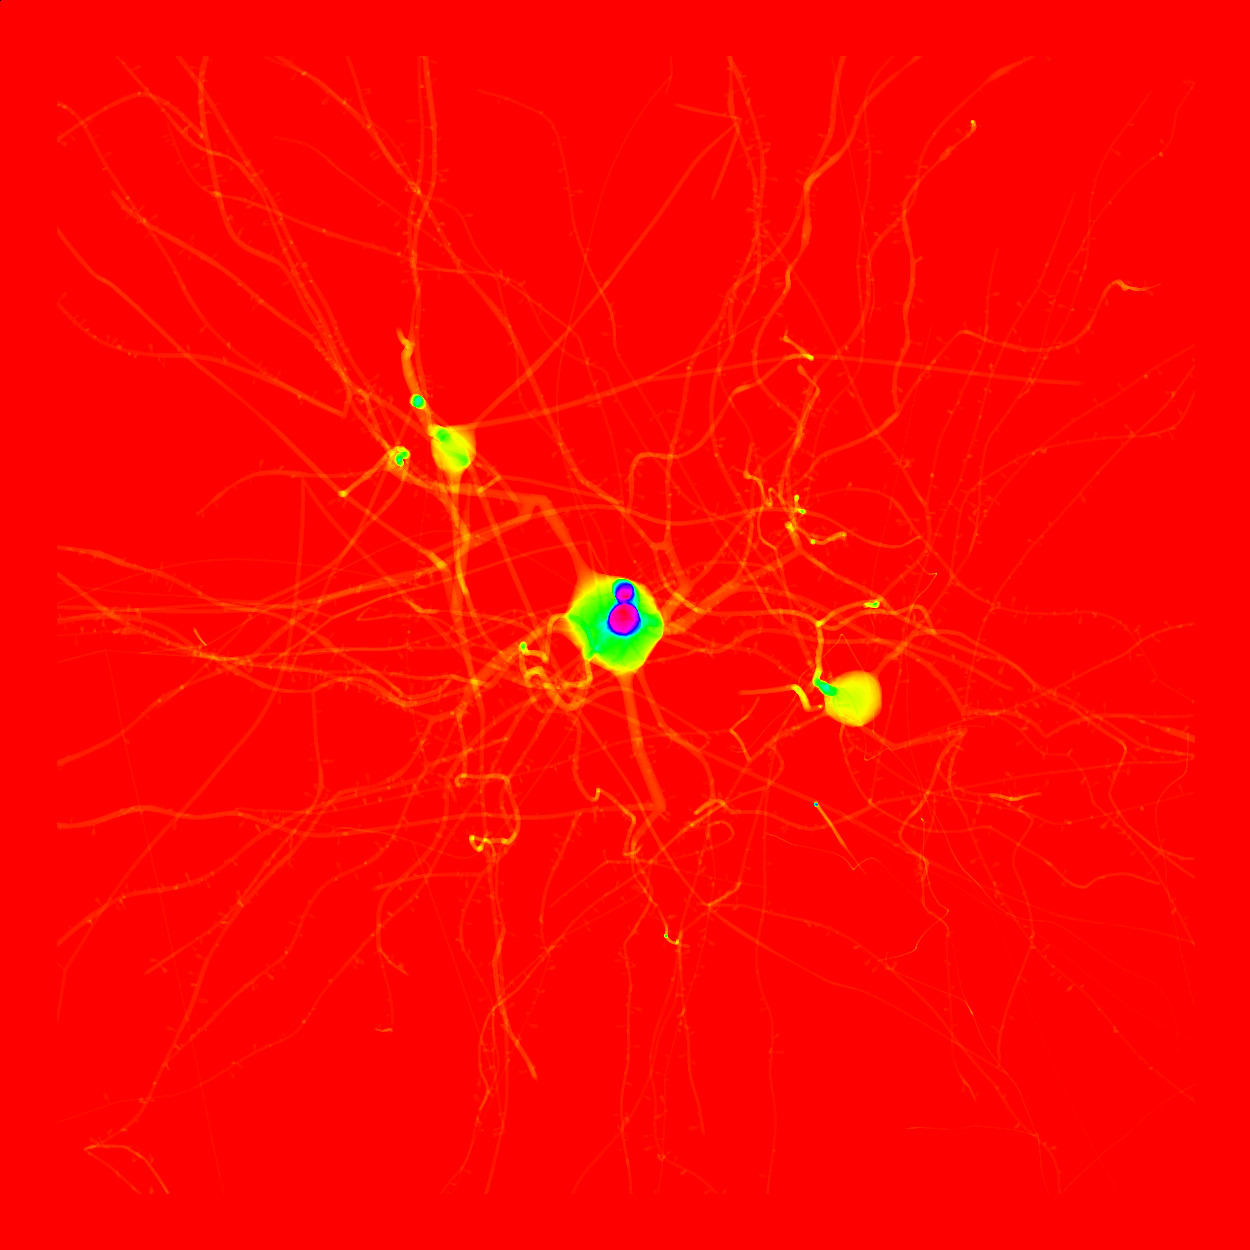 |
| PASTEL1 |  |
| PASTEL2 |  |
| PAIRED |  |
| ACCENT | 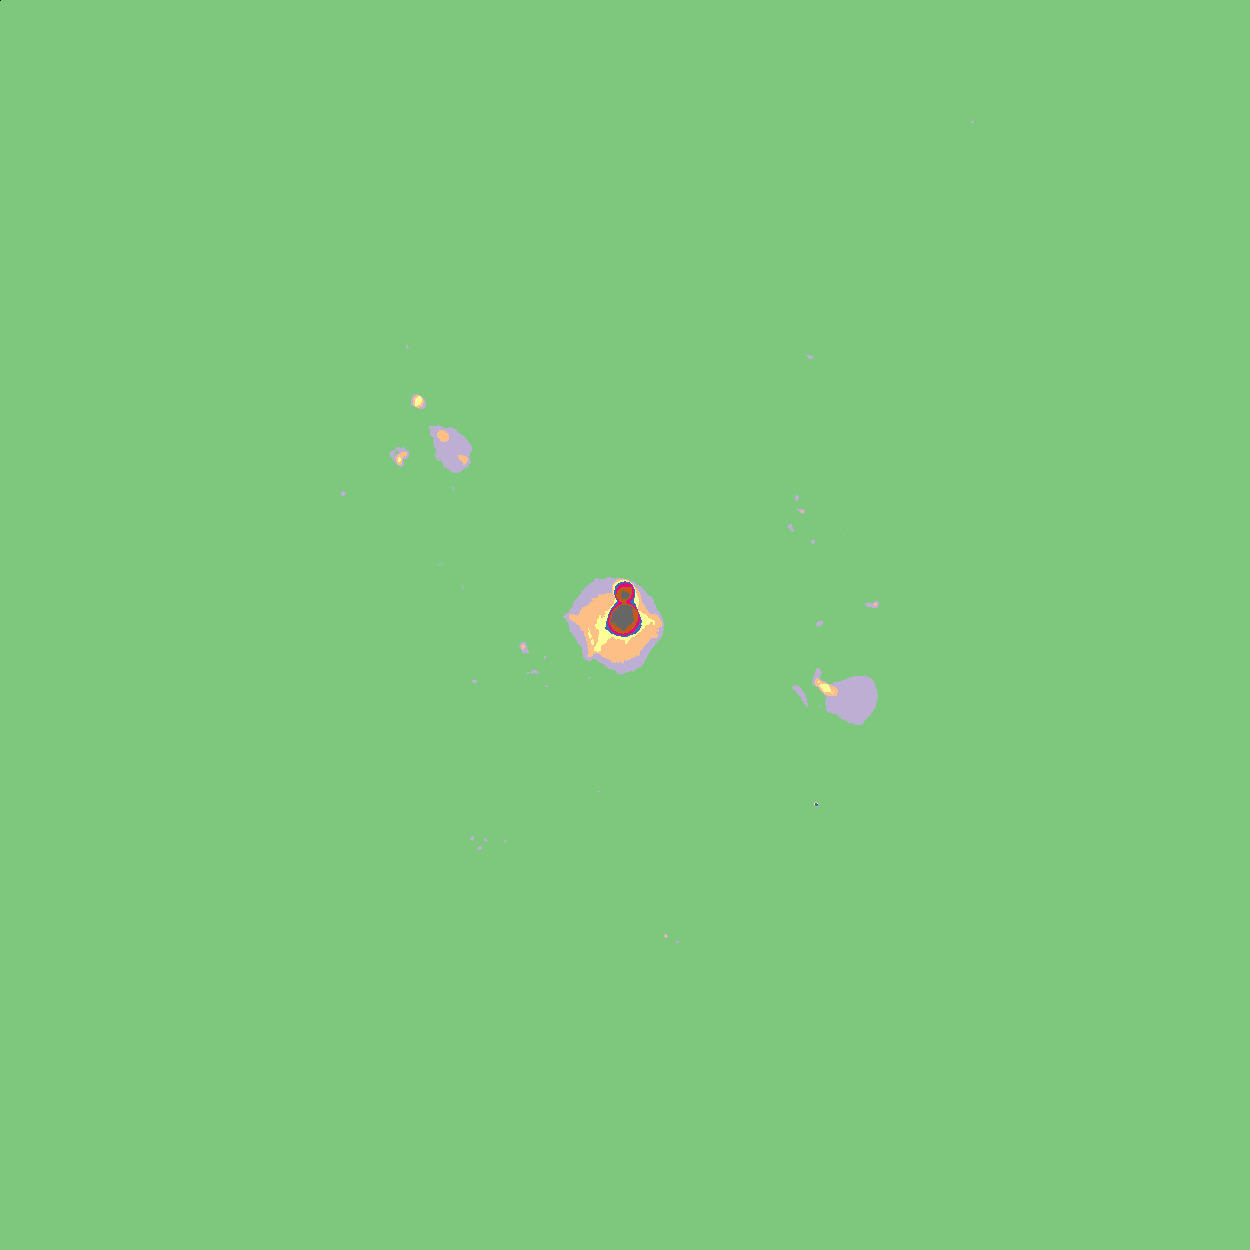 |
| DARK2 |  |
| SET1 |  |
| SET2 | 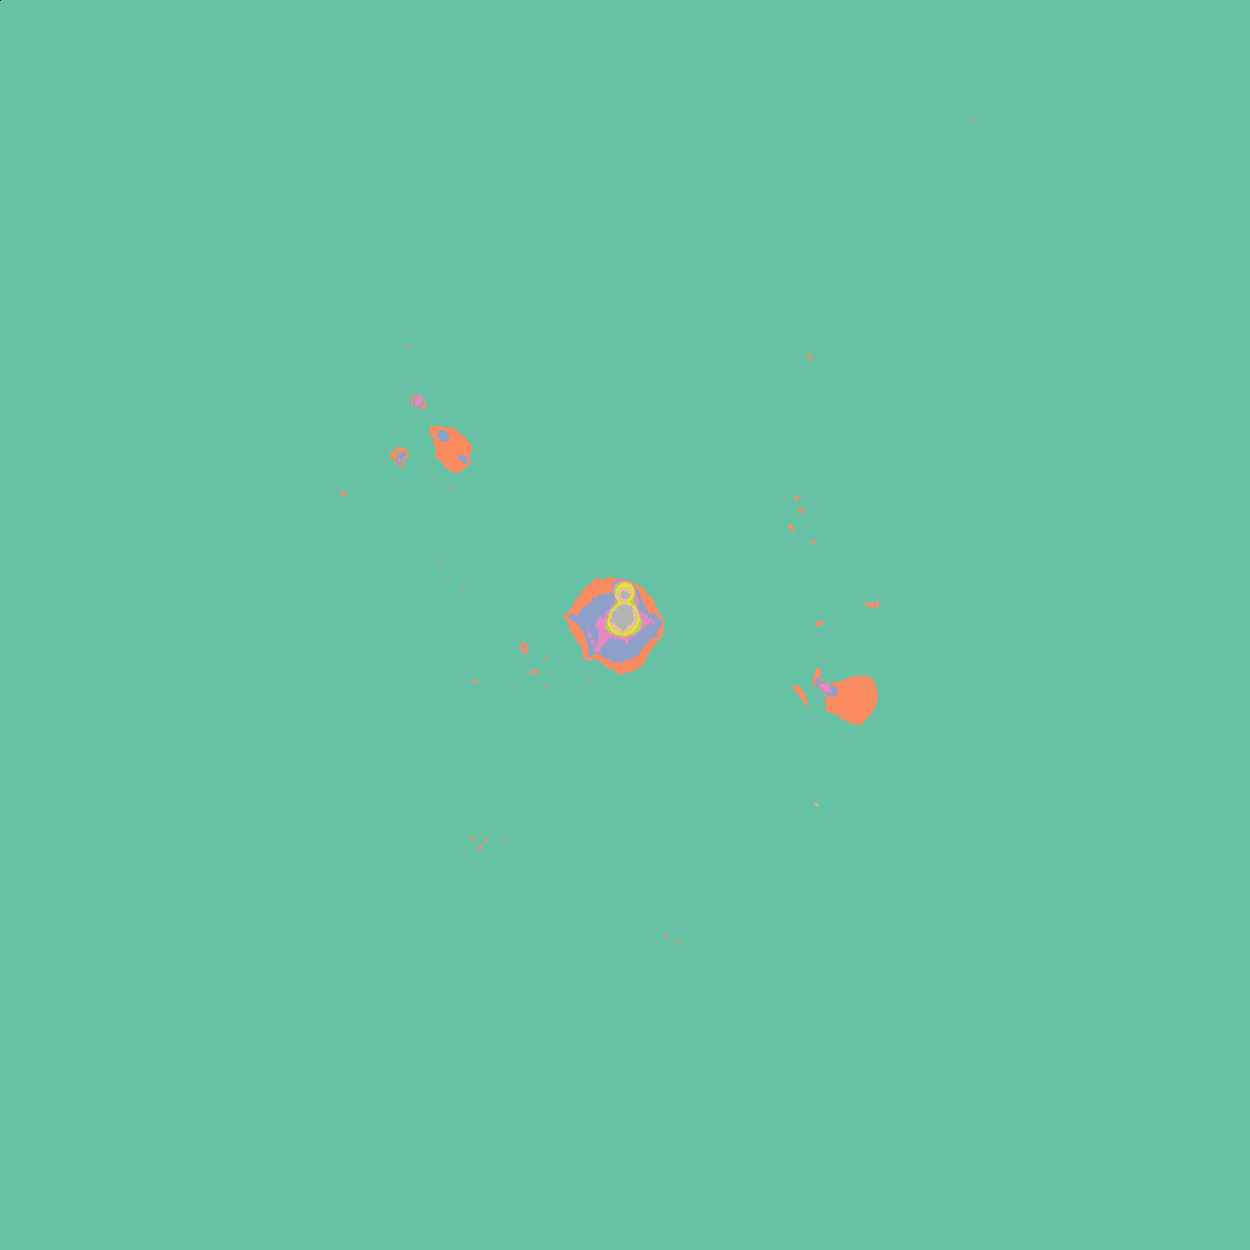 |
| SET3 |  |
| TAB10 |  |
| TAB20 |  |
| TAB20B | 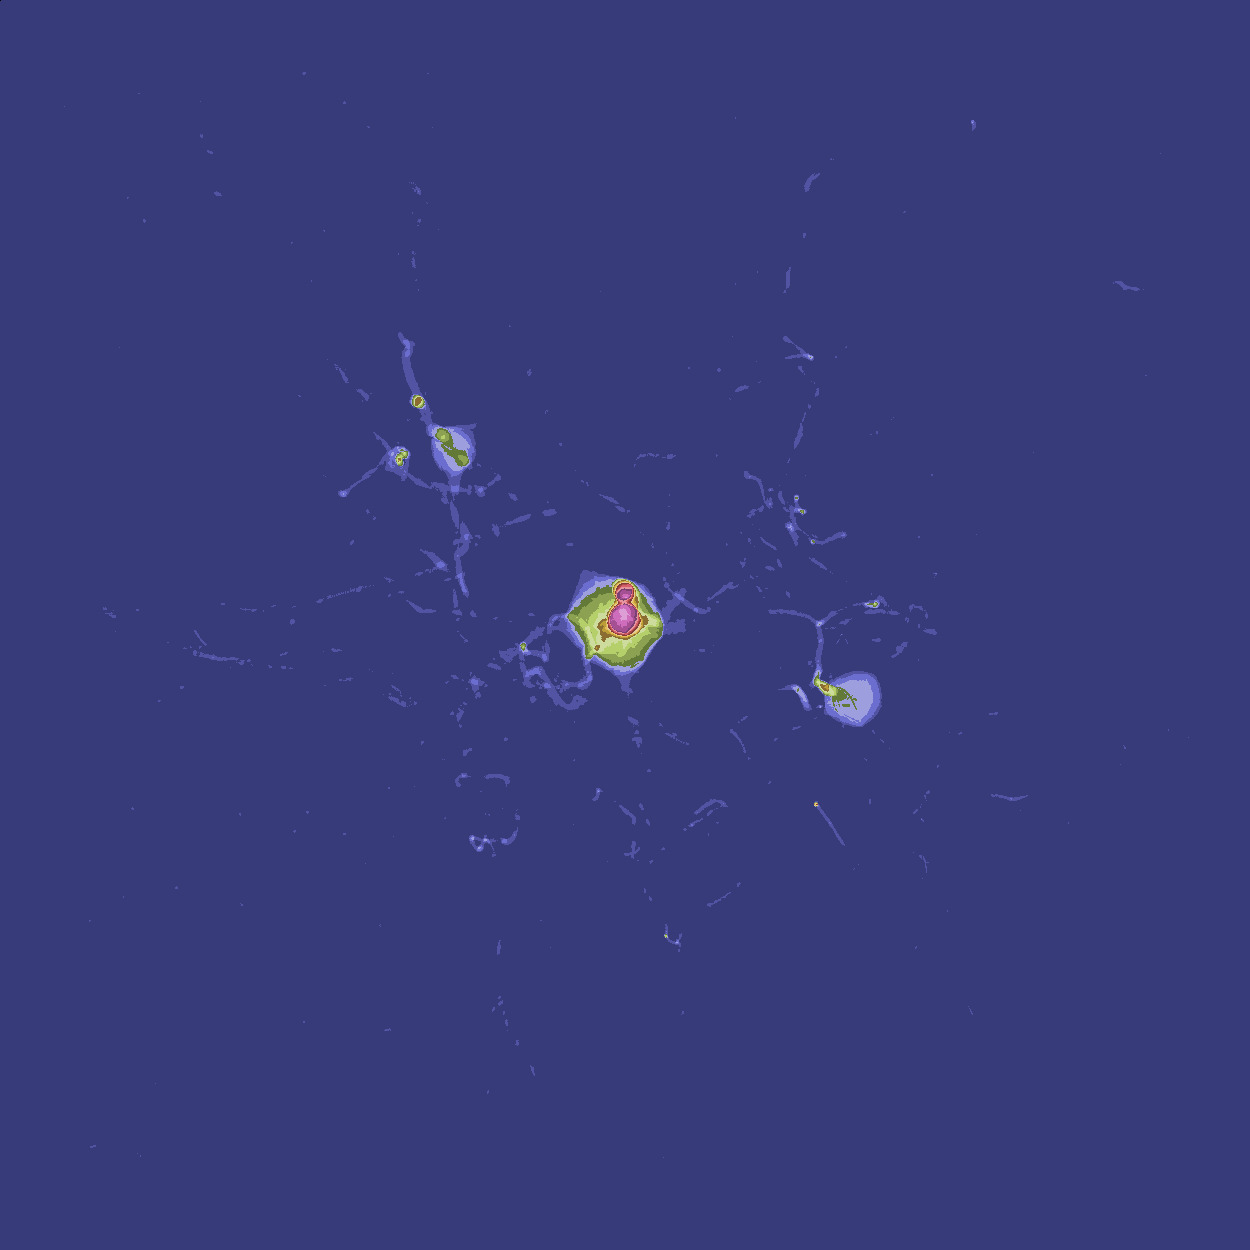 |
| TAB20C |  |
| FLAG |  |
| PRISM |  |
| OCEAN |  |
| GIST_EARTH |  |
| TERRAIN | 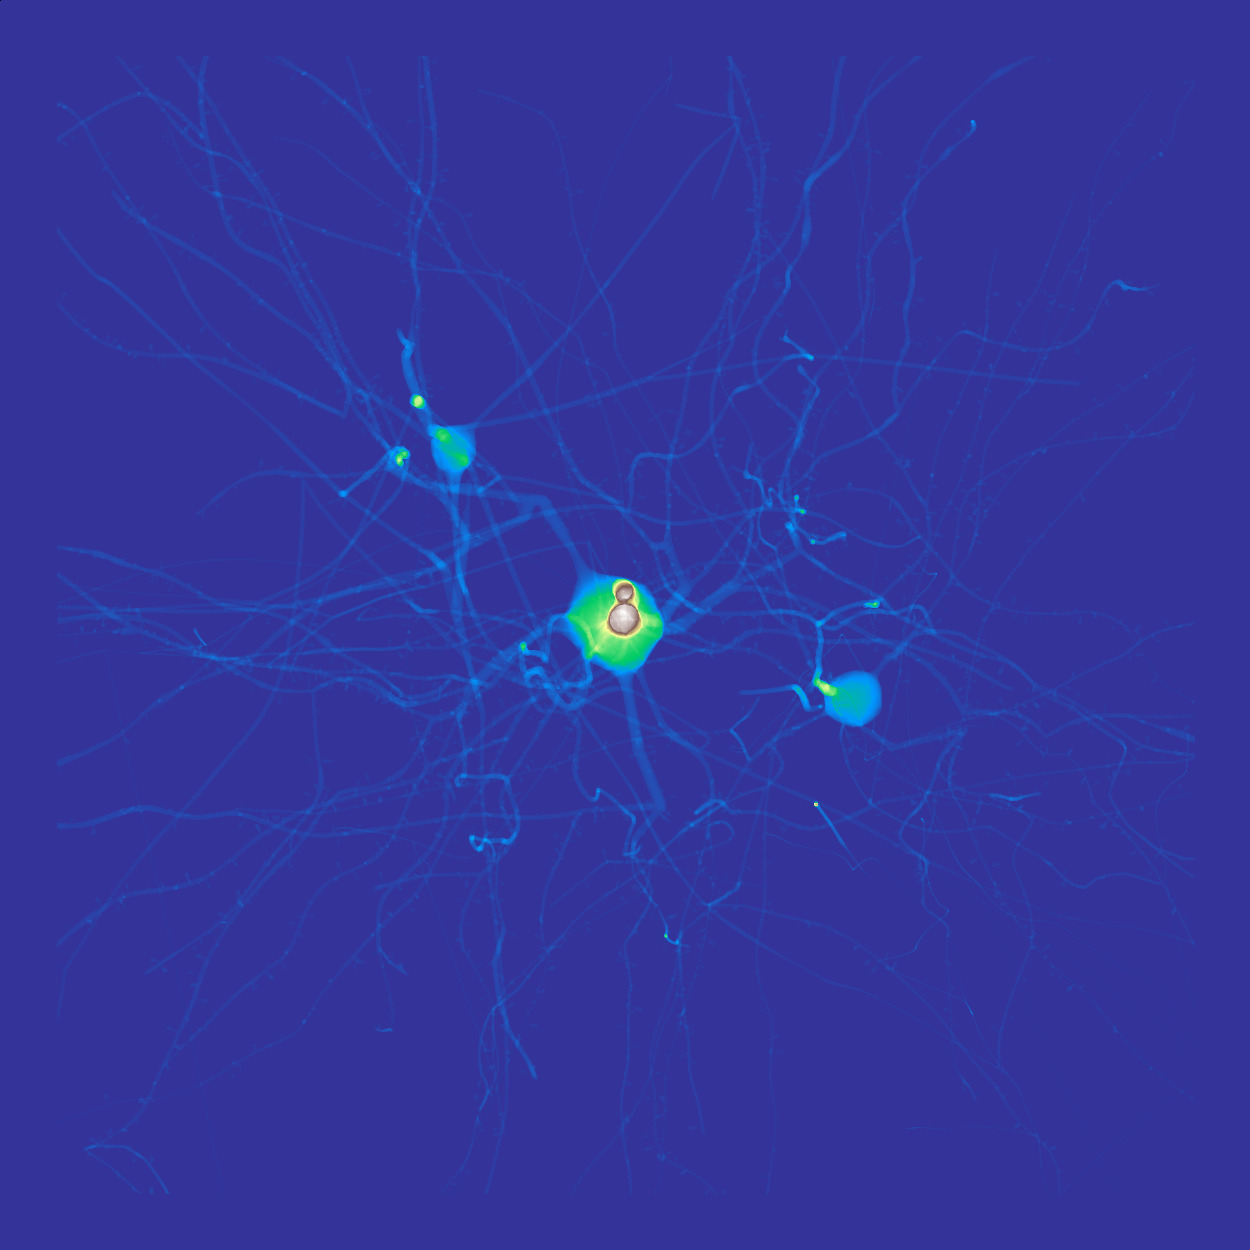 |
| GIST_STERN | 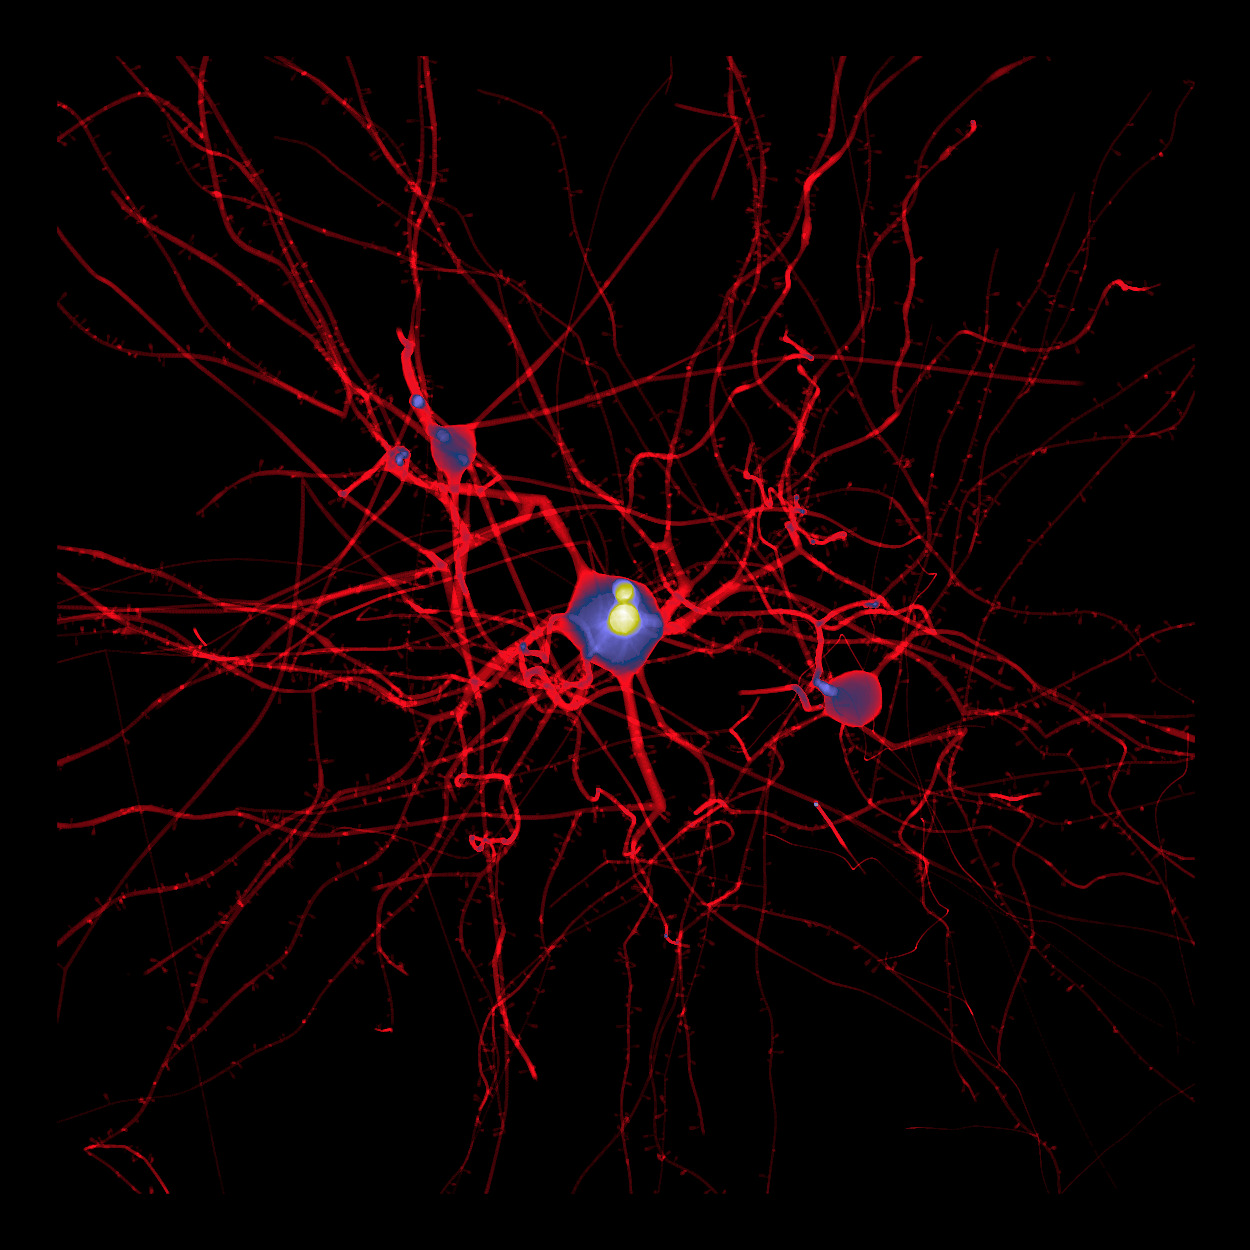 |
| GNUPLOT | 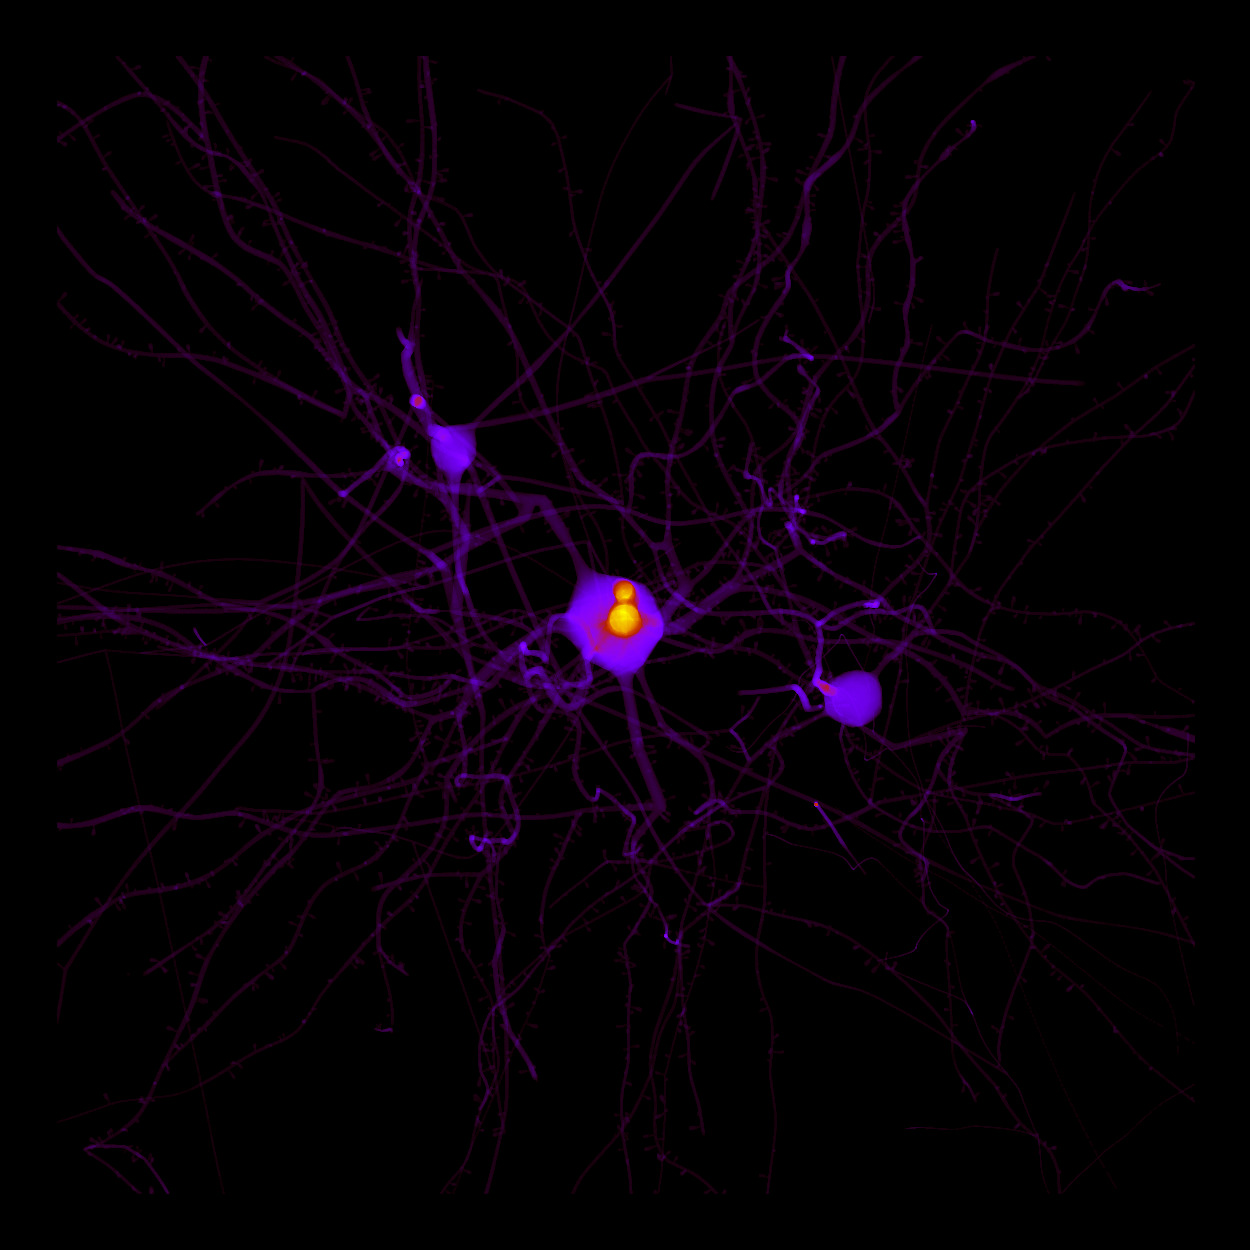 |
| GNUPLOT2 |  |
| CMRMAP |  |
| CUBEHELIX | 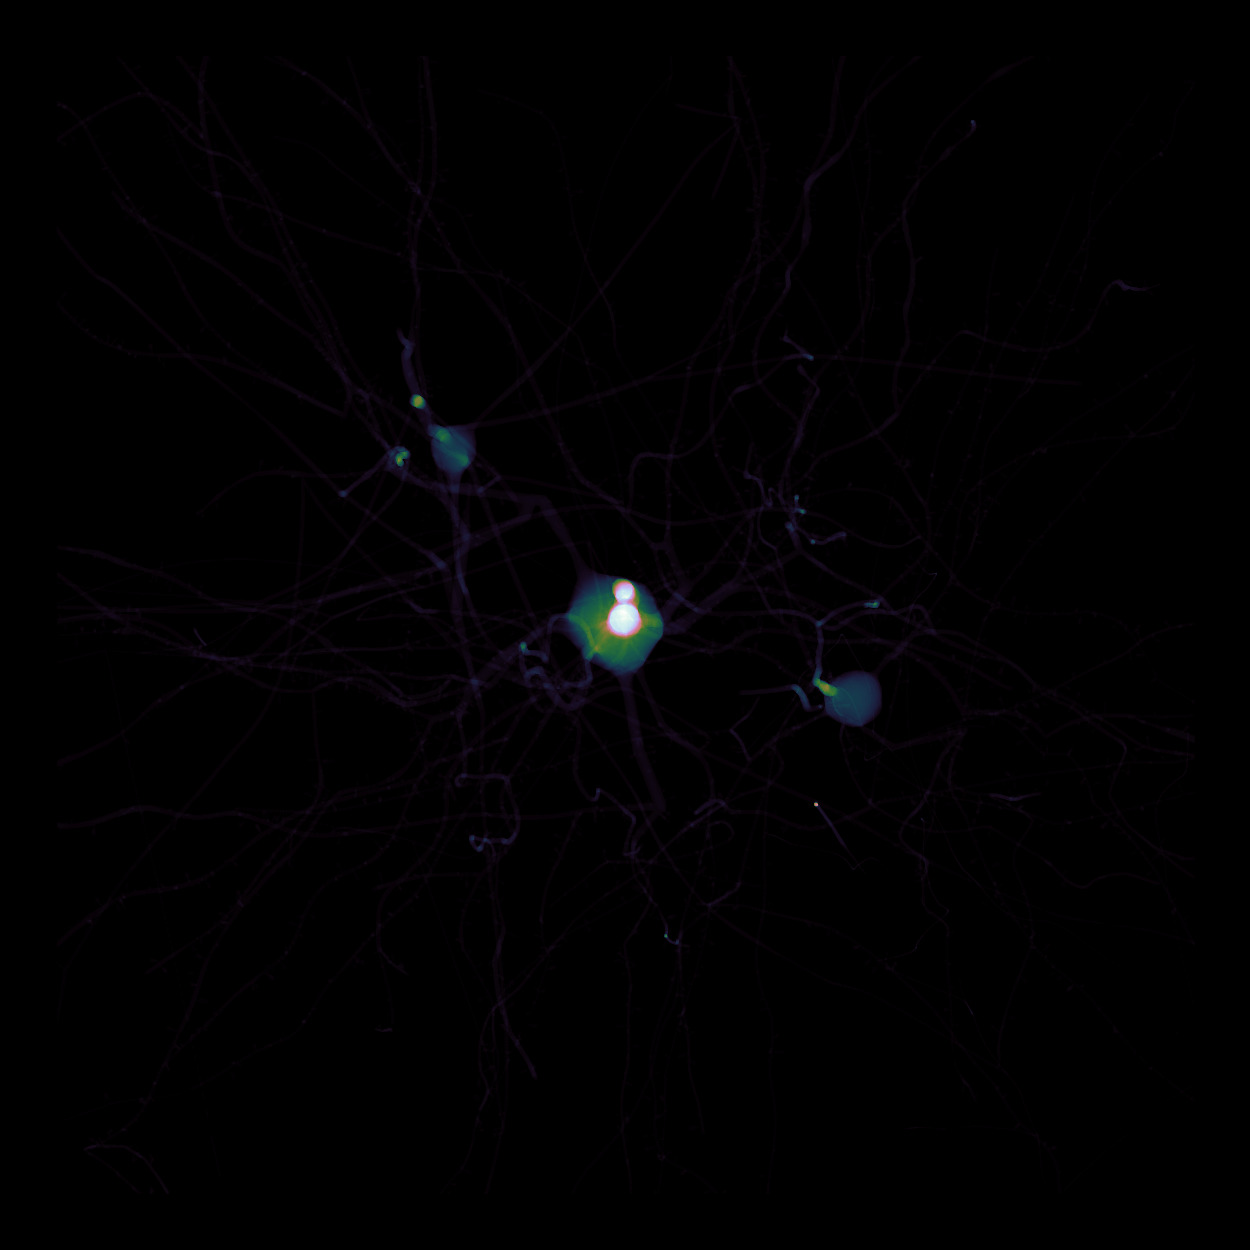 |
| BRG | 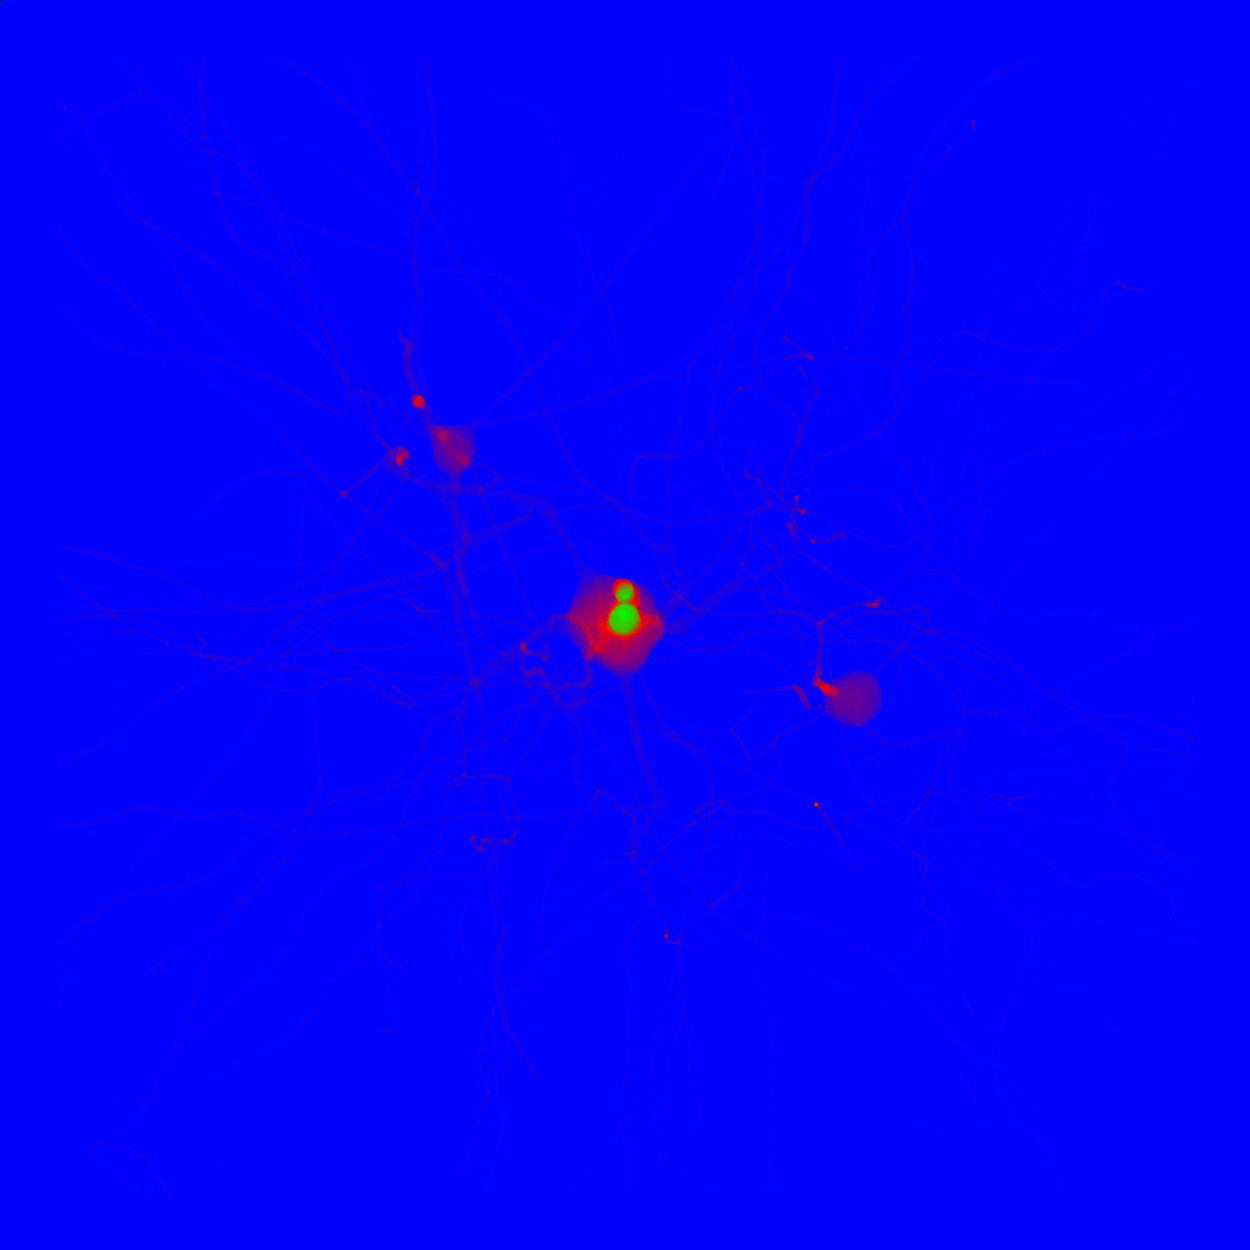 |
| GIST_RAINBOW |  |
| RAINBOW |  |
| JET |  |
| NIPY_SPECTRAL |  |
| GIST_NCAR |  |
The resulting projections will be generated to the projections folder within the user-define output directory. The suffix of each projection will indicate the name of the colormap used to create the projection.
If the base name of the input data or its prefix (defined by --prefix argument) for example is called neuron, and if the following projection flags are set in the command line --project-xy --project-zy --project-xz , then the following images will be created in the projections subdirectory :
output
|
+--> projections
|  |
|  +--> neuron-projection-xy.ppm
|  |
|  +--> neuron-projection-yz.ppm
|  |
|  +--> neuron-projection-xz.ppm
If the --project-color-coded flag is set, then and for every projection, a new image will be created having the following prefix neuron-xy-COLORMAP.ppm, neuron-zy-COLORMAP.ppm, and neuron-xz-COLORMAP.ppm. Note that all the colormaps will be created.
[1] Schwarz, Michael, and Hans-Peter Seidel. Fast parallel surface and solid voxelization on GPUs. ACM transactions on graphics (TOG) 29.6 (2010): 1-10.
[2] Abdellah, Marwan, et al. Reconstruction and visualization of large-scale volumetric models of neocortical circuits for physically-plausible in silico optical studies. BMC bioinformatics 18.10 (2017): 39-50.