by Christian Winkler, M.Sc.
This repository is dedicated to reference curves based on echocardiographic data for children. In case you want to develop references with your data or you want to understand how it works, this documentation and repository will help you by providing a lot of useful tools. Please note, that the presented methods can also be used for data other than echocardiographic.
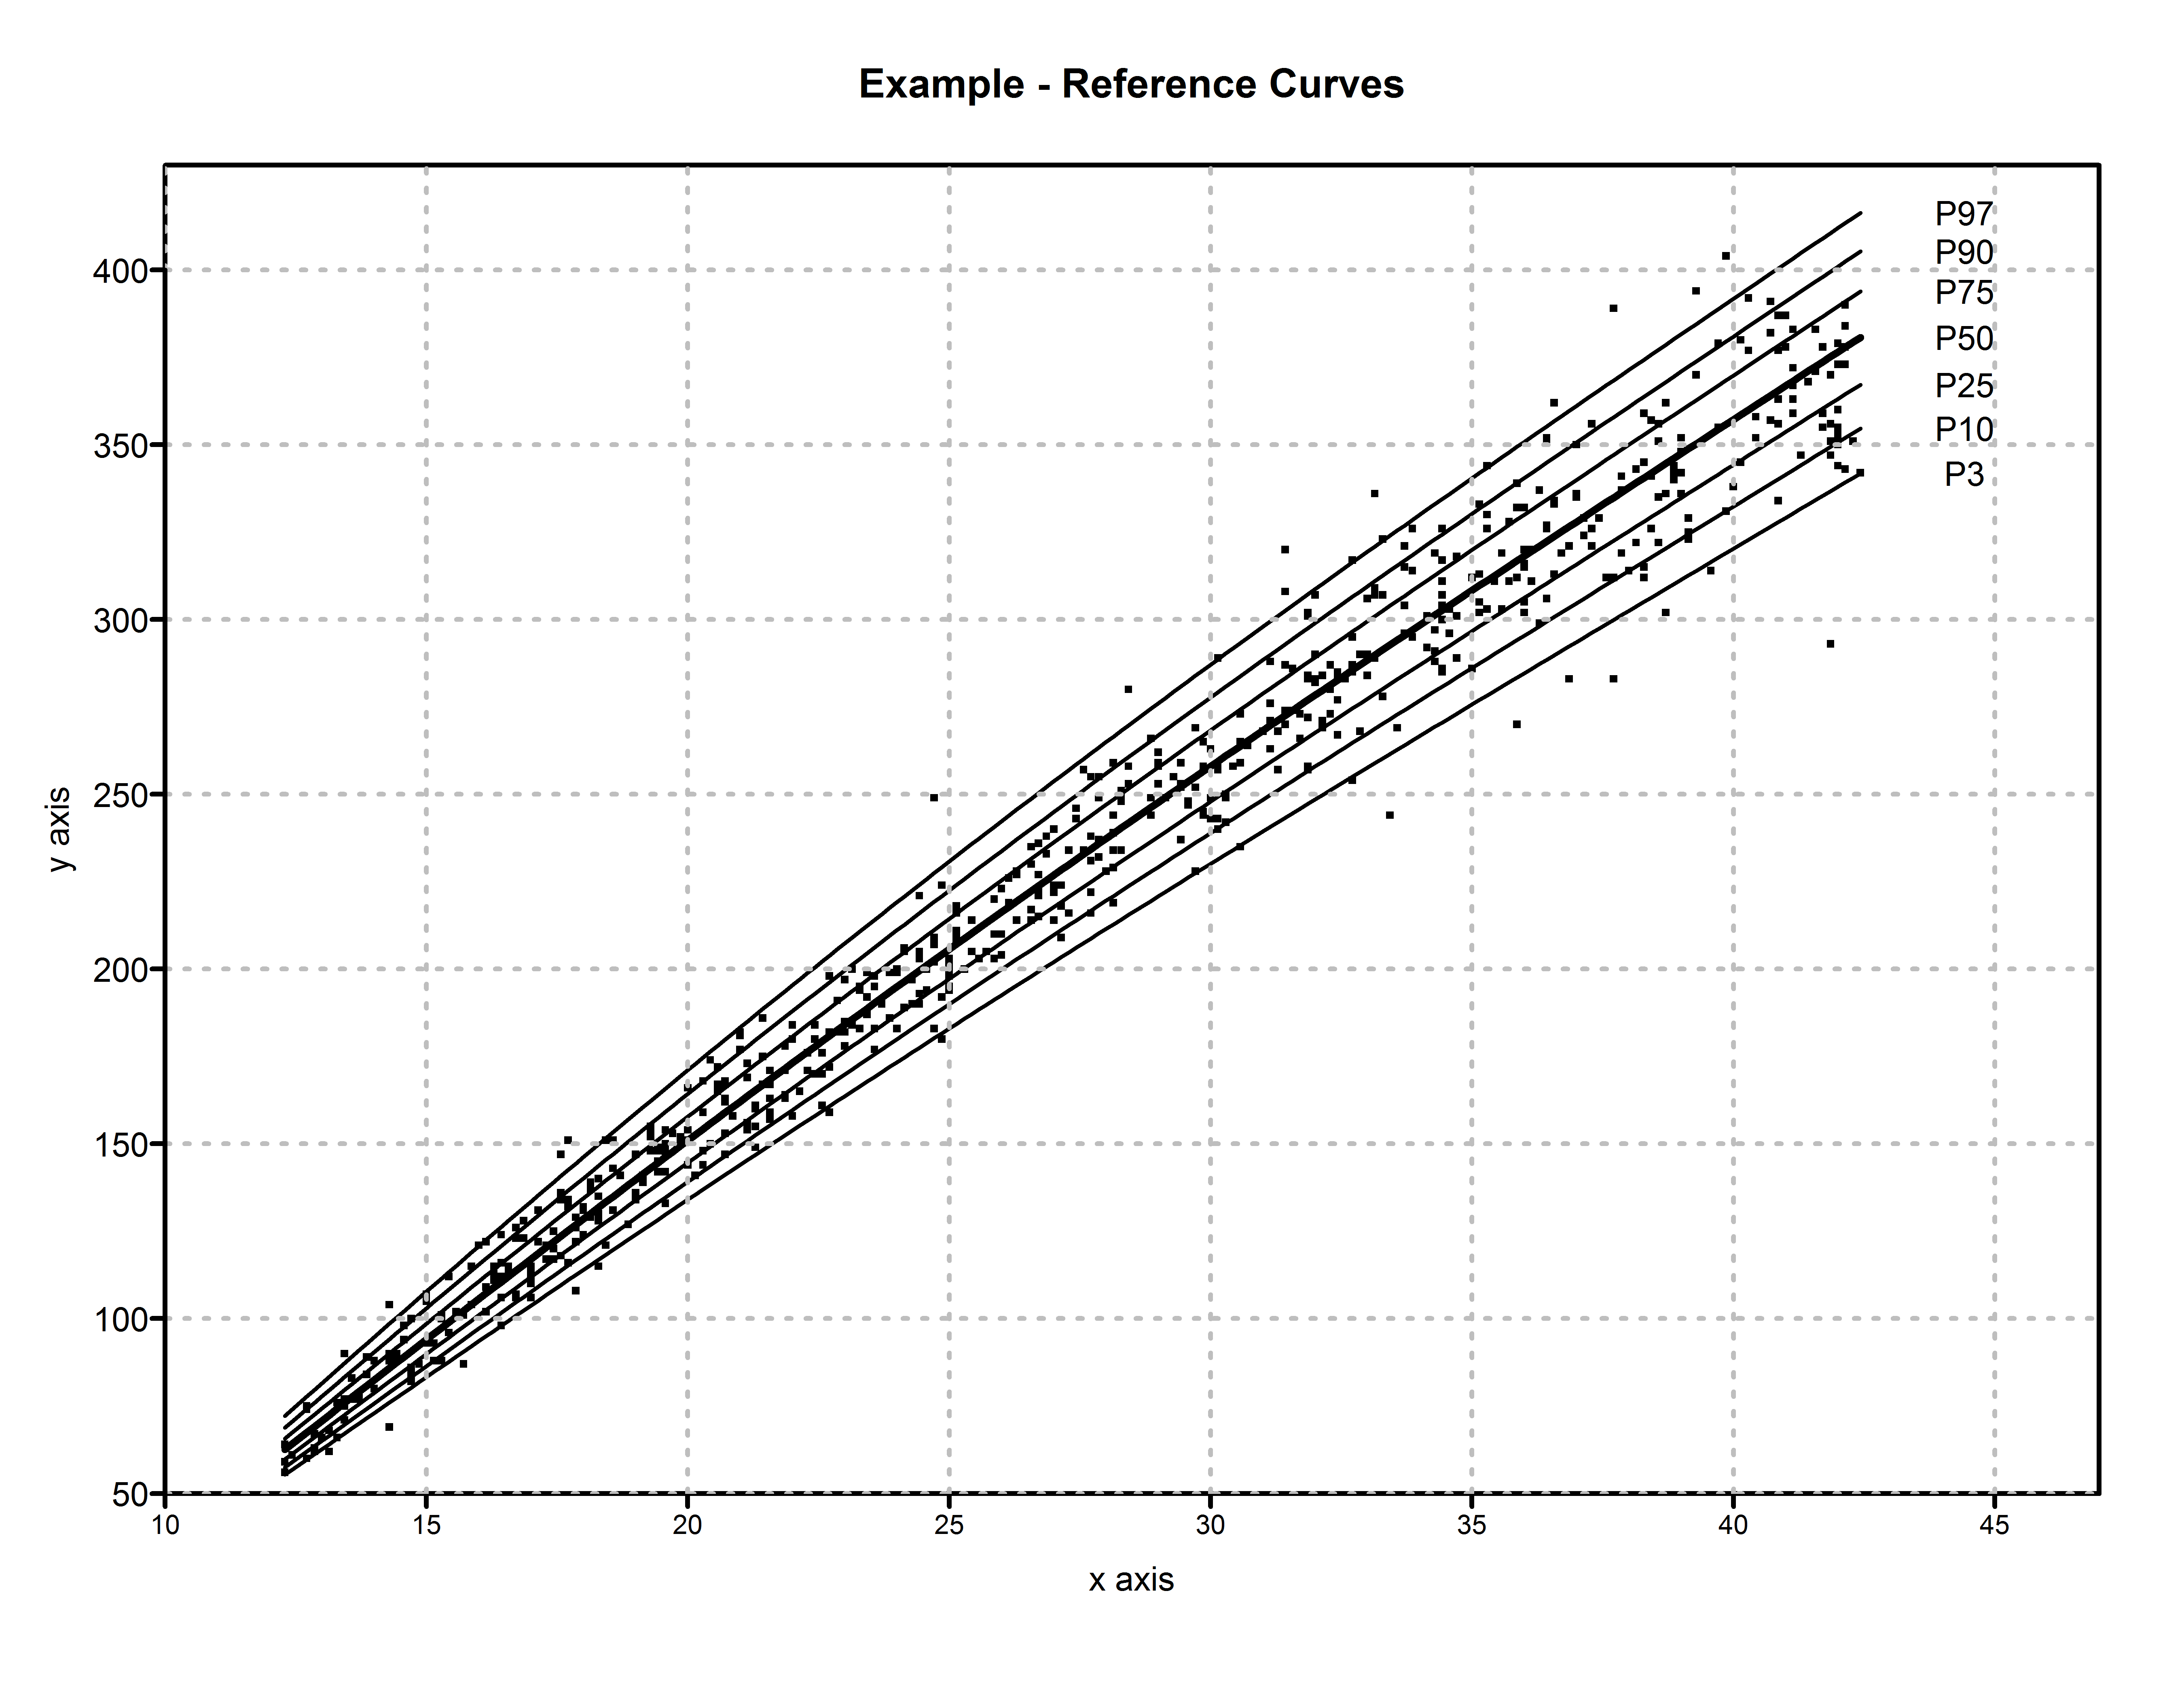
Following figure shows an example of reference curves:
The axes stand for two different variables. Usually, the age is chosen as x-axis and another variable of interest is chosen as y-axis. That can be the enddiastolic volume for example. Each shown data point stands for an individual subject that has been measured. In this example 610 observation were used. The different curves represent the percentiles of an underlying model. They are labeled as P3, P10, P25, P50, P75 and so on. The label P3 stands for the 3rd percentile, meaning that 3 percent of the data lies under the curve and 97 percent lies above. Accordingly, the 50th percentile indicates the median which seperates the data into 50/50. 50 percent of the data is below and 50 percent is above the curve. Therefore, the 50th percentile is often considered as a standard value. These kind of figures have become a tool for all kinds of examinations because they can be used easily in order to assess measured data and classify the patient. Many people know the growth charts or graphs for children. In literature, it is also common to use the term z-score instead of percentiles.
Some examples from diverse fields:
Classification of childhood weight (Wikipedia)
Coming soon.
Coming soon.
