Generalized 2D phonon transport using a Monte Carlo method
- Overview
- Feature Set
- Requirements
- Build Instructions
- Dependencies
- Python/JSON examples
- Output Format
- Visualizations
- Next Steps
- References
The program is designed to simulate phonon transport in nanostructures using a Monte Carlo method, aiming to better understand such structures' thermal properties. To speed up computations, the program uses C++17 parallelism features, including parallel algorithms and execution policies.
The Monte Carlo method simulates phonon transport by modelling the movement of individual phonons through the nanostructure. The program tracks the path of each phonon, as well as the amount of energy it carries. It uses this information to calculate the thermal conductivity and temperature of the nanostructure.
The program is intended for researchers and engineers working in nanotechnology and can be customized to simulate various types of nanostructures with different material properties.
- Nanostructures are specified by a
.jsonfile generated in Python. - Multiple
.jsonfiles can be provided as input. - Theoretically, unrestricted 2D geometrical configurations are possible, although there are practical limitations. See Next Steps: Model Creation.
- The program can be run in "full" simulation mode using the methodology described by [1].
- The program can also be run in "deviational" mode using the methodologies described in [2] and [3].
- The "deviational" mode is recommended unless you are doing low-temperature (below ~100 K) simulations.
- Three different simulation types are available:
- Steady-state: provides a snapshot of the system once it reaches the steady-state.
- Periodic: allows the user to visualize how the system reaches the steady-state.
- Transient: allows the user to model bursts of heat throughout the system.
The software has no dependencies or third-party requirements, although you may need TBB if your compiler does not support C++17 parallel algorithms and execution policy. CMake 3.21+ is required.
See tests for working OS/compiler combinations.
If you have all the necessary dependencies, you can run make release in the directory containing the makefile. The executable can then be found here: build/psim/Release/psim.
-
A C++ compiler that supports C++17. See cppreference.com to see which features are supported by each compiler. The following compilers should work:
On Debian/Ubuntu, these can be installed by running the following commands:
sudo apt update
sudo apt install cmake
sudo bash -c "$(wget -O - https://apt.llvm.org/llvm.sh)"
sudo apt install ninja-build
Then navigate to the directory containing makefile and run the command:
make releaseIn the python_sim folder, there are 3 .py files. Running these files should produce the .json files in the .json folder. These are the files you can pass into the psim program. For example, if you put the .json files in the same directory as the psim executable, then you can run all five simulations using the command:
./psim *.jsonSome pre-built configurations can be found at psim_python\psim\pre_builts.py. This can give an idea of how to construct your systems, but this can be a complicated process depending on the intricacies of your desired configuration.
The table below outlines the data found in the output files.
| Quantity | Description |
|---|---|
| temp | Temperature |
| temp std | Standard deviation of the temperature |
| x-flux | Phonon flux in the x-direction |
| x-flux std | Standard deviation of the phonon flux in x |
| y-flux | Phonon flux in the y-direction |
| y-flux std | Standard deviation of the phonon flux in y |
The first line contains details about the run. The remaining lines follow the format:
| temp | temp std | x-flux | x-flux std | y-flux | y-flux std |
|---|
Each entry corresponds to the associated sensor in the .json file. That is, the first entry corresponds with the first sensor, etc.
The first line contains details about the run. The remaining lines follow the format:
| simulation step |
|---|
| number of sensors or number of measurements that follow this line |
|---|
| temp | temp std | x-flux | x-flux std | y-flux | y-flux std |
|---|
This pattern is repeated to give chronological snapshots of the system and these can be strung together to see the system evolution.
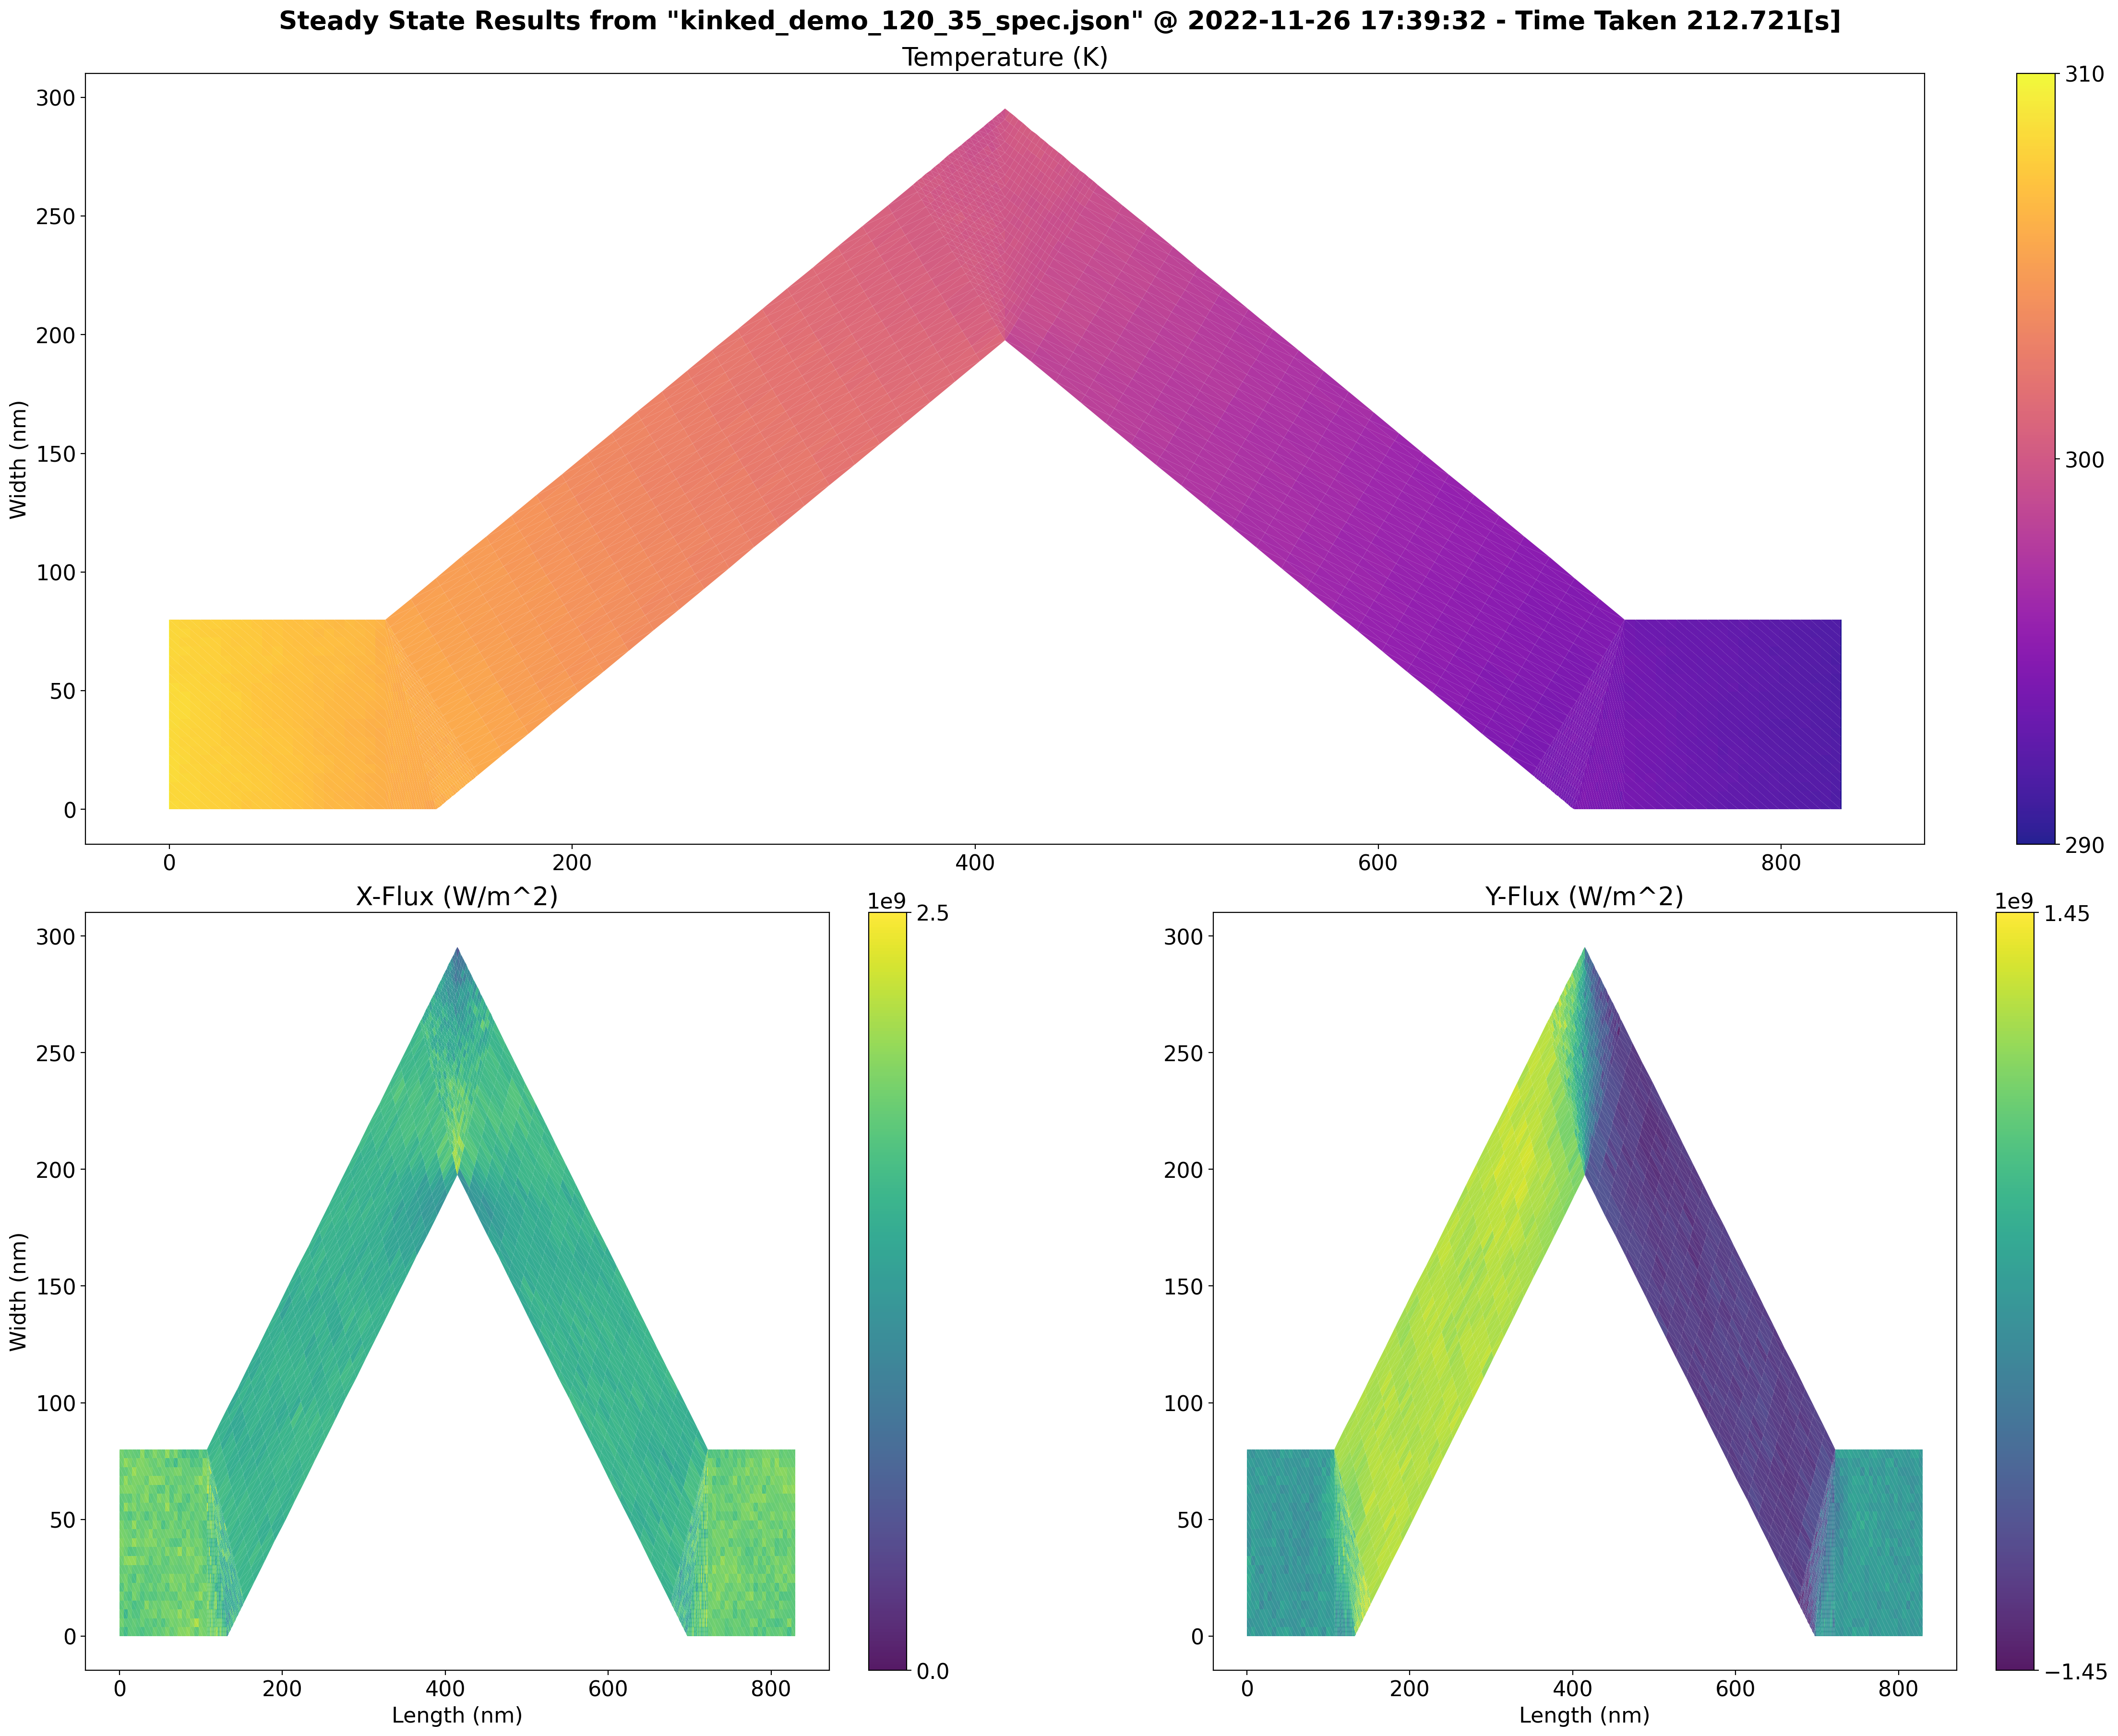
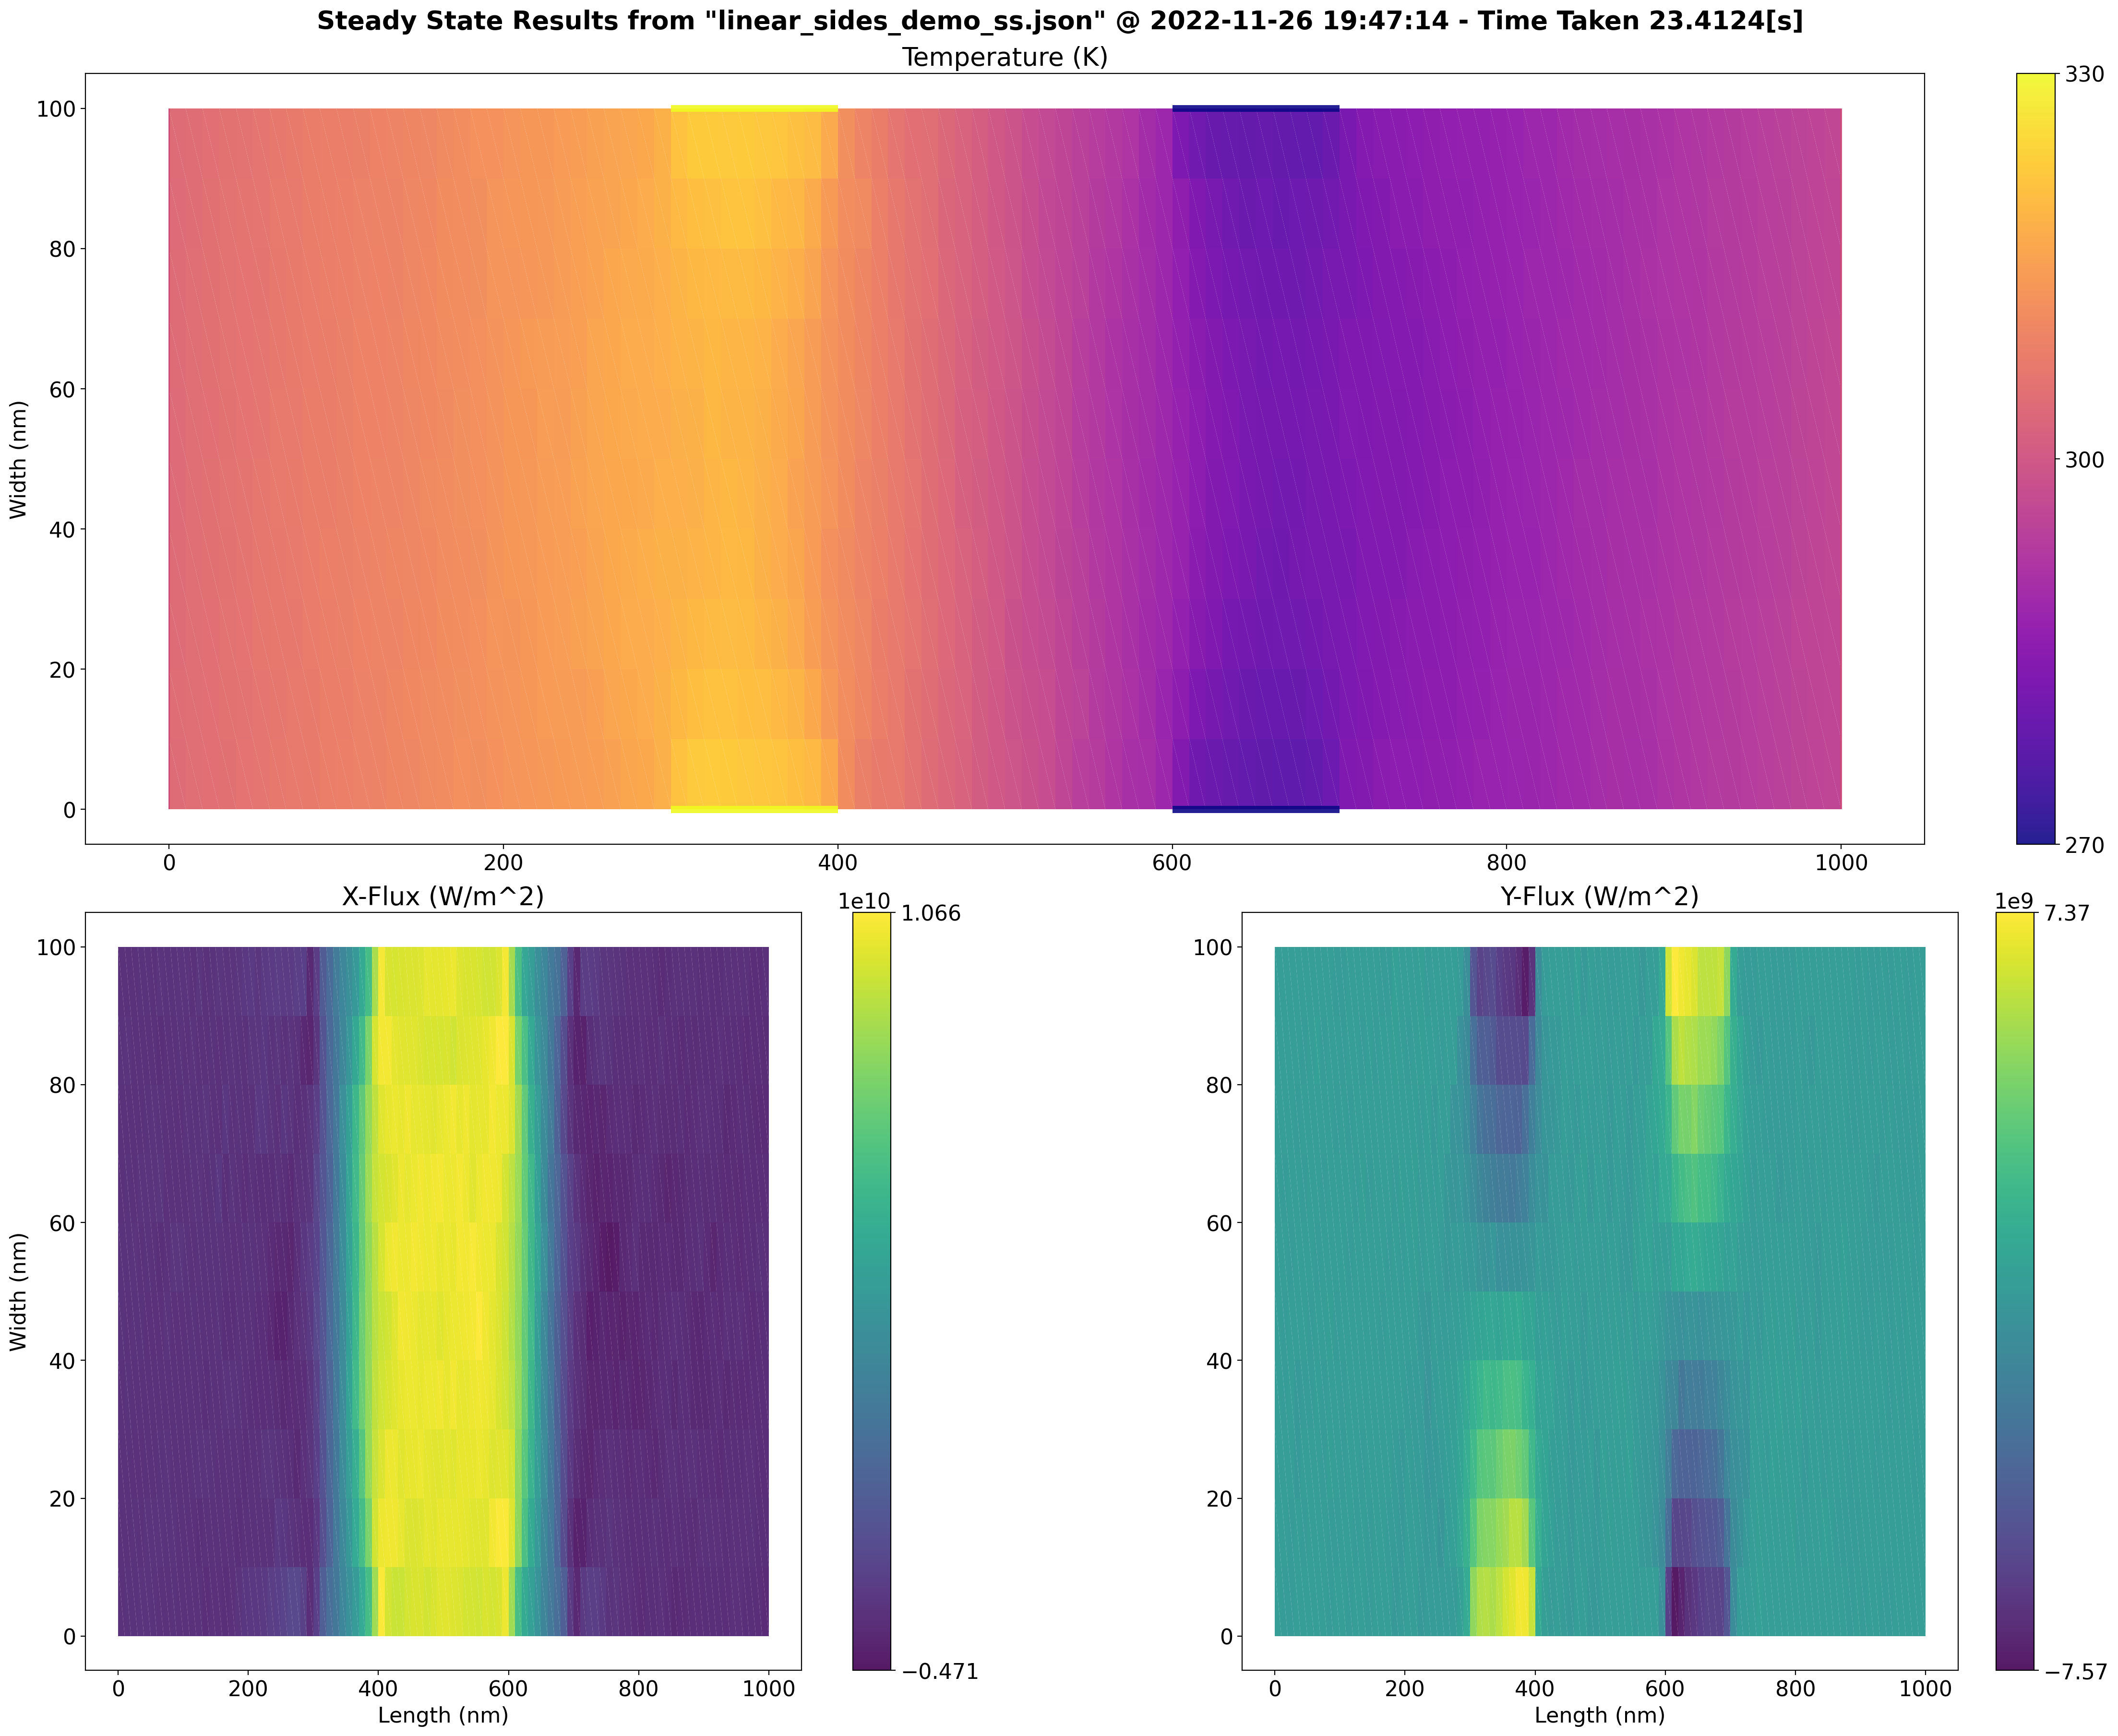
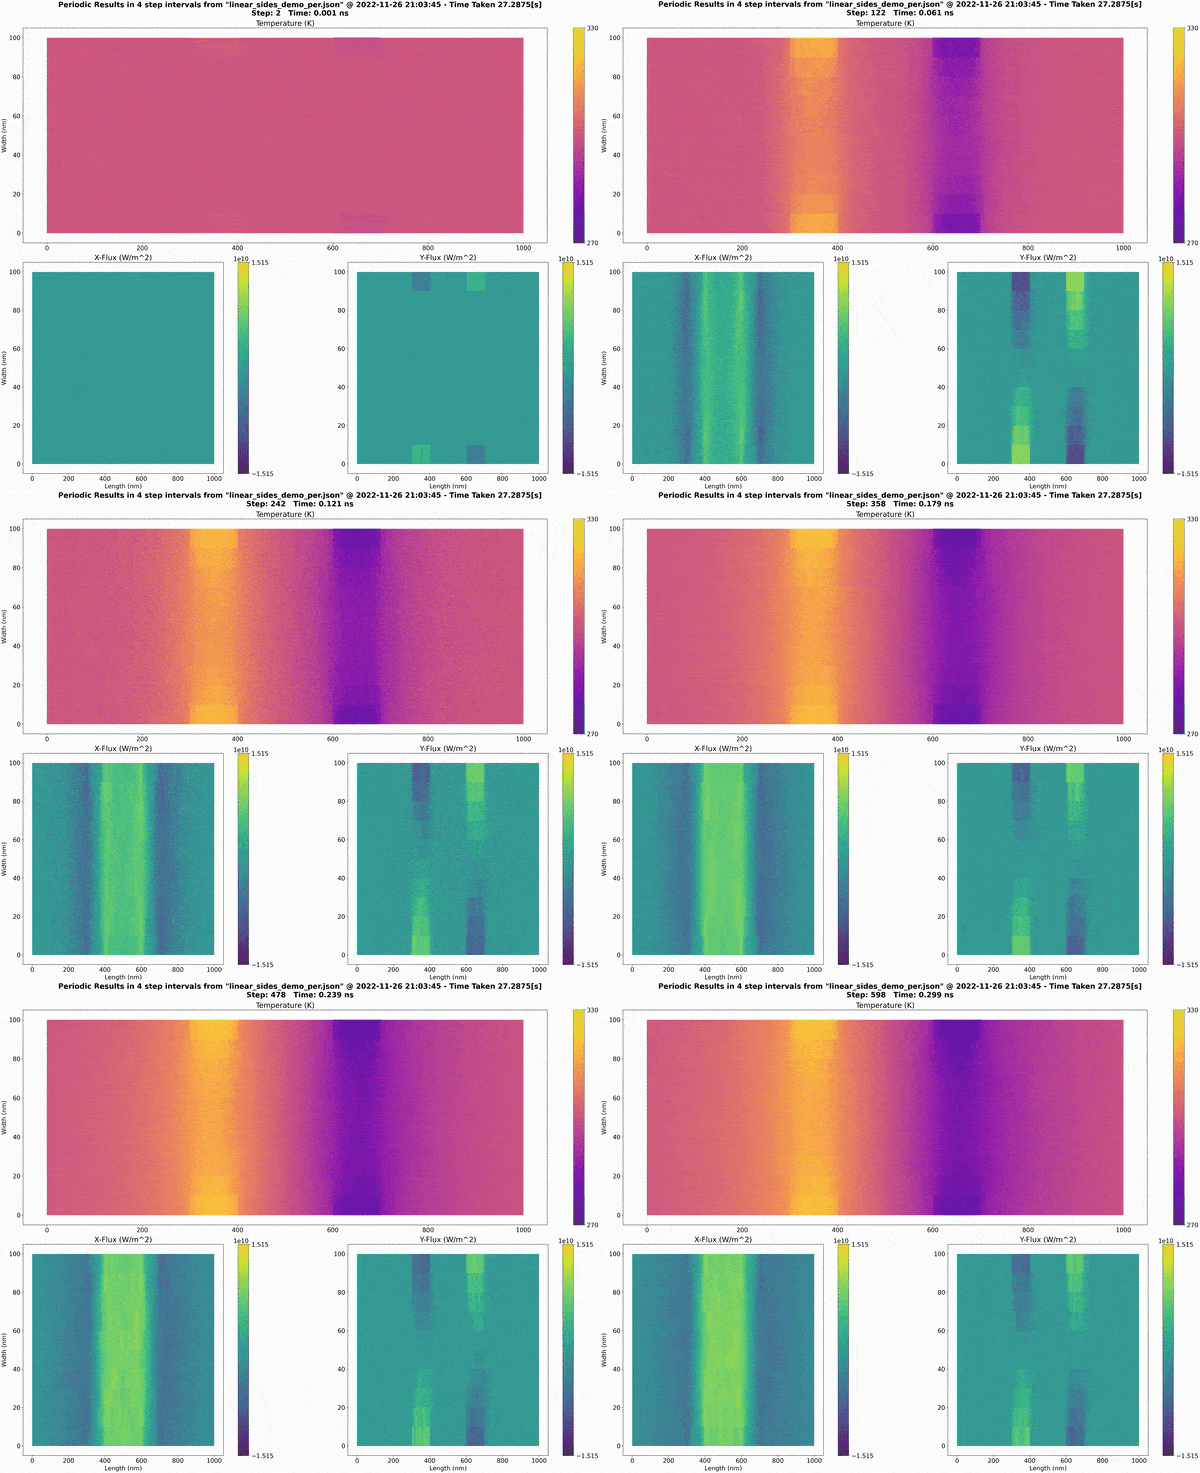
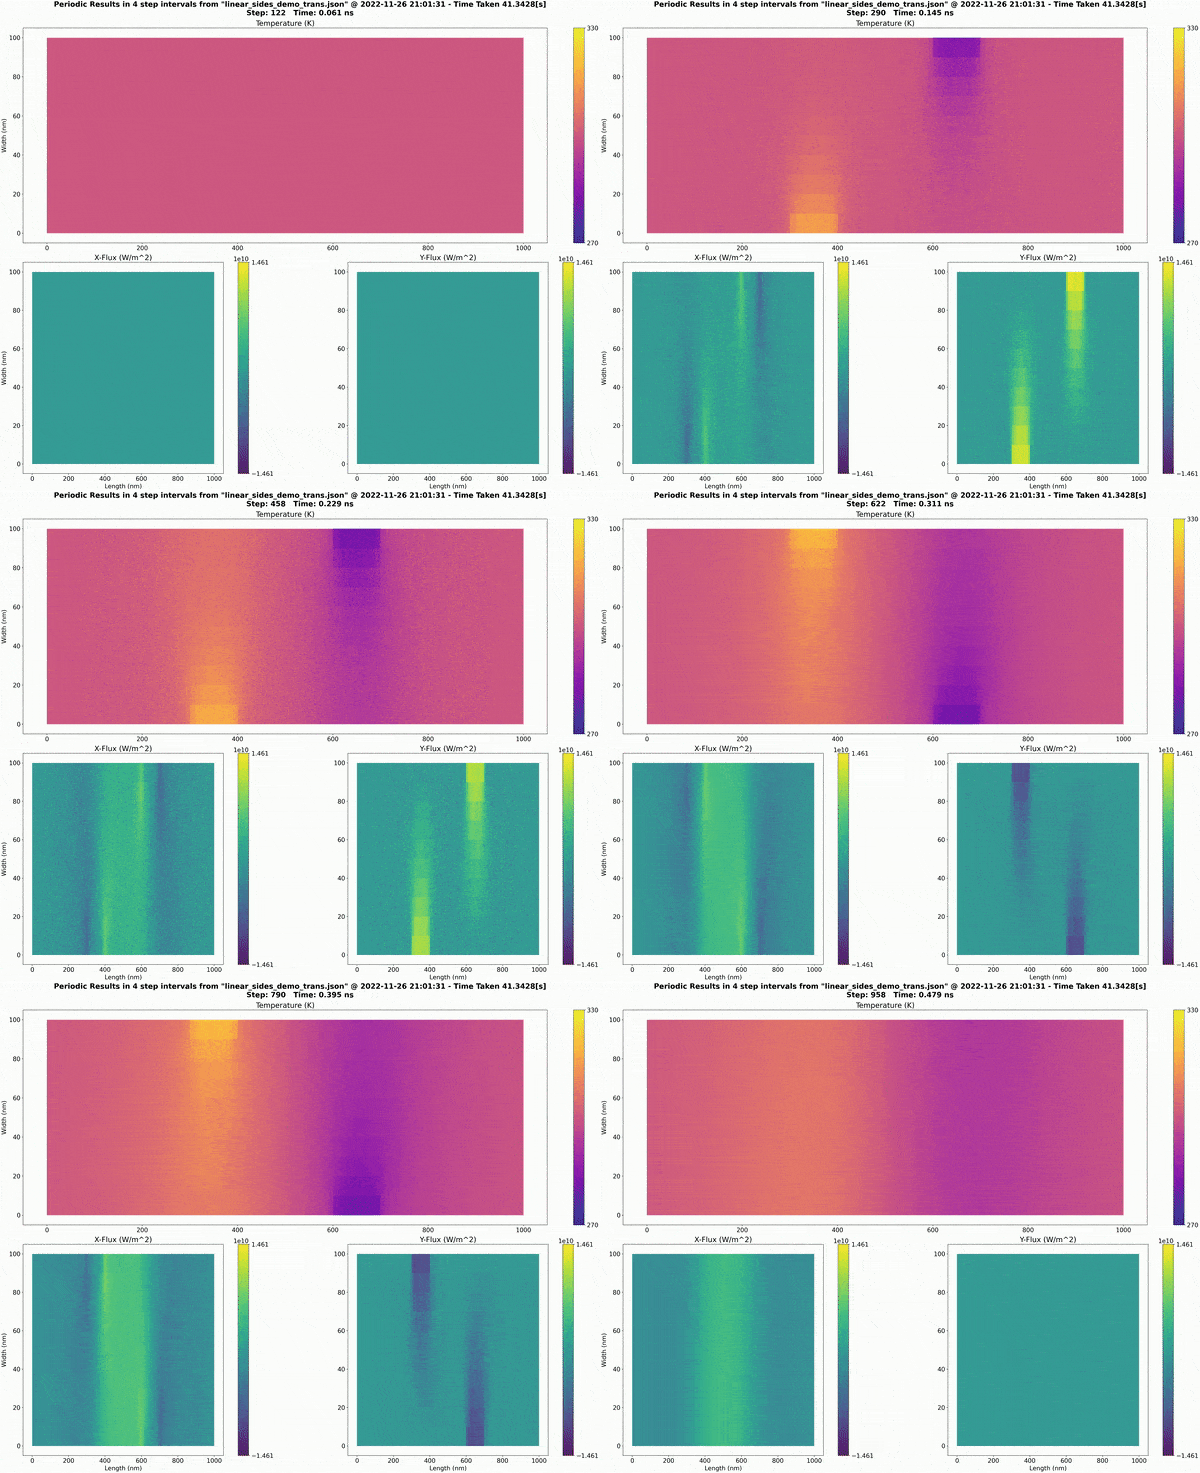
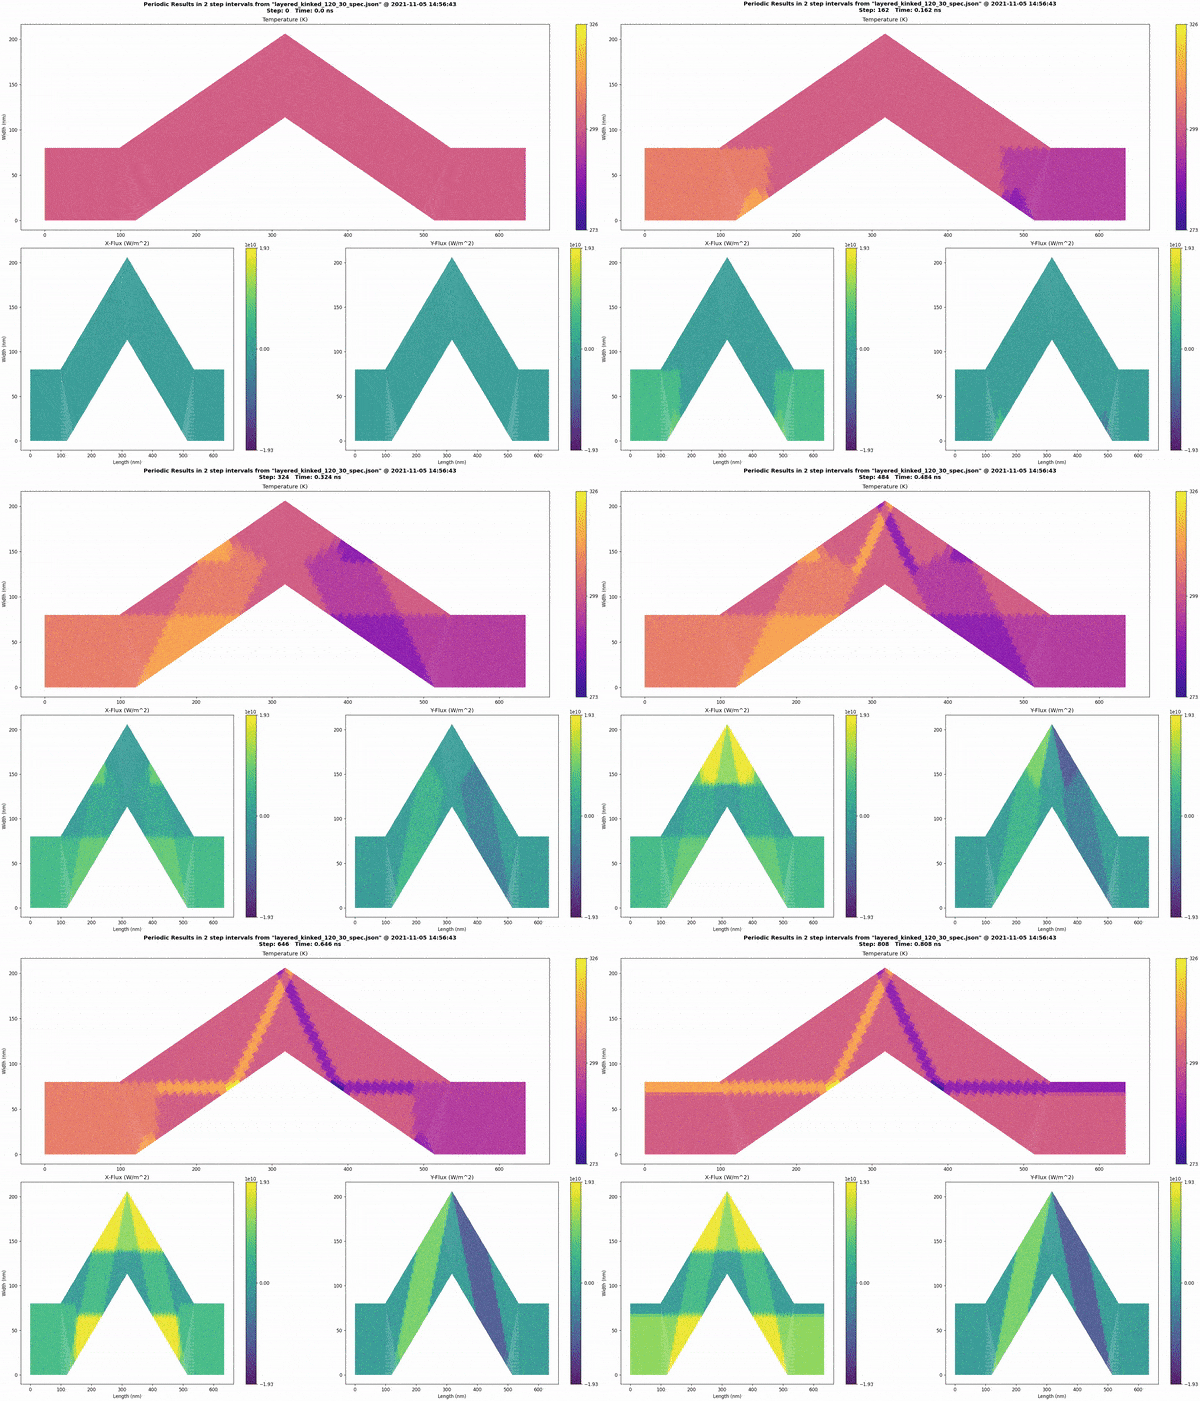
In the visualization process, the original JSON file is combined with the output file to generate plots. Typically, the initial temperature and values specified in the JSON file are replaced by the corresponding values from the simulation results file. Linear systems can be handled more simply, as can be seen in plotly_plotter.py.
The following visualizations can be built using the code in matplotlib_plotter.py. The code to create these visualizations can be found in the corresponding demo files. The plotly_plotter.py file generates interactive HTML plots, but it is only helpful for simple linear systems.
- Specifying complicated nanostructures using the existing Python code can be tedious.
- The current implementation could be better for modelling complex structures, particularly for users unfamiliar with Python programming.
- Future program versions may include a more user-friendly interface for specifying and visualizing nanostructures.
- This could include a graphical user interface (GUI) that allows users to create and modify nanostructures using a visual editor.
- Other potential improvements include importing models from other software packages.
- These improvements would make the program more accessible to a broader range of users and facilitate modelling more complex and realistic nanostructures.
- The current software allows the straightforward creation of systems consisting of various materials.
- However, the interface interaction between different materials still needs to be handled.
- Currently, the only interface consideration is that backscattering occurs if an incoming phonon is incompatible with the new material. Improvements can be made starting at line 89 in
surface.cpp. - Complex interface interactions can be addressed using promising techniques in [4] and [5].
- The model does not consider optical phonon branches.
- Software currently requires the user to specify simulation duration.
- Implementing a steady-state detection mechanism is a better approach.
- The mechanism should stop the program once it detects that the system has reached a steady state.
- Stopping the simulation can be done when the flux across each cell is constant within some margin of error for a certain amount of time.
- Allowing for unrestricted 3D geometries would enhance the existing model.
- A relatively simple intermediate step would allow the user to specify a single measurement that represents the z-axis dimension for the entire system.
- This would let the user set emitting surfaces and alter surface specularity in that dimension.
- Improve structure of visualization code
- Refactor and optimize existing code
- Modularize visualization code
- Separate into reusable functions
- Create better-designed classes
- Enhance maintainability and extensibility
- Explore alternative visualization libraries and techniques
- Improve plot quality and interactivity
- Ensure easy analysis of simulation results
- Improve overall performance of plotting utilities
- Address long video generation times for periodic and transient simulations
[1]: D. Lacroix, K. Joulain, and D. Lemonnier, “Monte Carlo transient phonon transport in silicon and germanium at nanoscales,” Physical Review B, vol. 72, no. 6, p. 064305, 2005.
[2]: J.-P. M. Péraud and N. G. Hadjiconstantinou, “Efficient simulation of multidimensional phonon transport using energy-based variance-reduced Monte Carlo formulations,” Physical Review B, vol. 84, no. 20, p. 205331, 2011.
[3]: J.-P. M. Péraud and N. G. Hadjiconstantinou, “An alternative approach to efficient simulation of micro/nanoscale phonon transport,” Applied Physics Letters, vol. 101, no. 15, p. 153114, 2012.
[4]: A. J. Minnich, G. Chen, S. Mansoor, and B. Yilbas, “Quasiballistic heat transfer studied using the frequency-dependent Boltzmann transport equation,” Physical Review B, vol. 84, no. 23, p. 235207, 2011.
[5]: Y.-C. Hua and B.-Y. Cao, “Study of phononic thermal transport across nanostructured interfaces using phonon Monte Carlo method,” International Journal of Heat and Mass Transfer, vol. 154, p. 119762, 2020.


