Binary cross entropy is a loss function used for binary classification tasks (tasks with only two outcomes/classes). It works by calculating the following average:
The above equation can be split into two parts to make it easier to understand:
The above graph shows that the further away the prediction is from the actual y value the bigger the loss gets.
That means that if the correct answer is 0, then the cost function will be 0 if the prediction is also 0. If the prediction approaches 1, then the cost function will approach infinity.
If the correct answer is 1, then the cost function will be 0 if the prediction is 1. If the prediction approaches 0, then the cost function will approach infinity.
Resources:
- Understanding Categorical Cross-Entropy Loss, Binary Cross-Entropy Loss, Softmax Loss, Logistic Loss, Focal Loss and all those confusing names
- Cross entropy
- Understanding binary cross-entropy / log loss: a visual explanation
Code:
Categorical crossentropy is a loss function used for multi-class classification tasks. The outputed loss is the negative average of the sum of the true values multiplied by the log of the predicted values
.
Resources:
- Understanding Categorical Cross-Entropy Loss, Binary Cross-Entropy Loss, Softmax Loss, Logistic Loss, Focal Loss and all those confusing names
- Categorical crossentropy
Code:
The fraction of predictions the model classified correctly.
or
For binary classification, accuracy can also be calculated in terms of positives and negatives as follows:
Resources:
- 'Classification: Accuracy' Google Machine Learning Crash Course
- Accuracy Score Scikit Learn
- Precision and recall
Code:
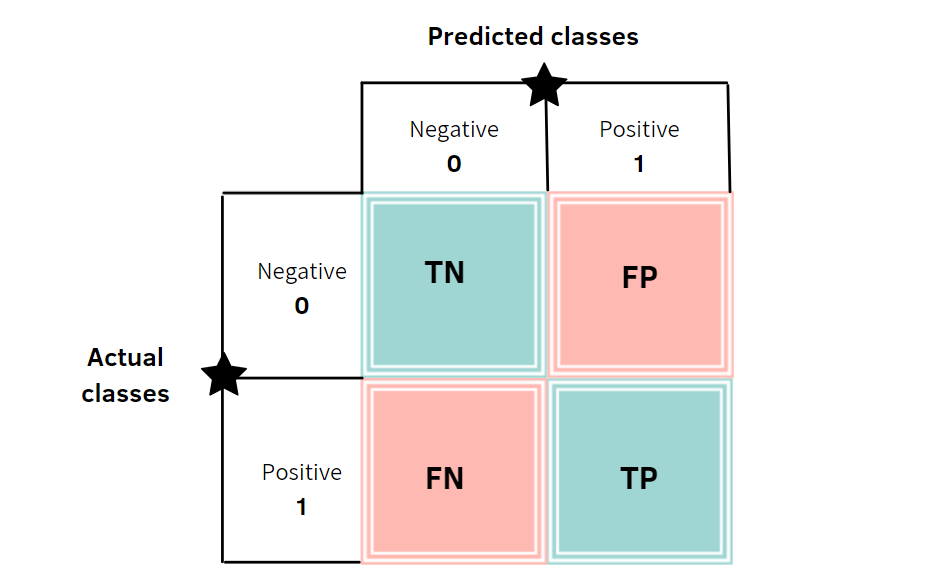
A confusion matrix is a table that summarises the predictions of a classifier or classification model. By definition, entry in a confusion matrix is the number of observations actually in group
, but predicted to be in group
.
Resources:
- Confusion matrix Scikit-Learn
- What is a Confusion Matrix in Machine Learning
- Simple guide to confusion matrix terminology
Precision is a metric for classification models that identifies the frequency with which a model was correct when predicting the positive class. Precision is defined as the number of true positives over the number of true positives plus the number of false positives.
Resources:
- Precision, recall and F-measures
- Precision-Recall
- Precision Wikipedia
- Classification: Precision and Recall
- Accuracy, Precision, Recall or F1?
Code:
Recall is a metric for classification models that identifies how many positive labels the model identified out of all the possible positive labels.
Resources:
- Precision, recall and F-measures
- Precision-Recall
- Precision Wikipedia
- Classification: Precision and Recall
- Accuracy, Precision, Recall or F1?
Code:
The F1-Score is the harmonic mean of precision and recall. A perfect model will have an F1-Score of 1.
It's also possible to weight precision or recall differently using the -Score. Here a real factor
is used to weight the recall
times as much as the precision.
Resources:
- Precision, recall and F-measures
- What is the F-score?
- Accuracy, Precision, Recall or F1?
- F-score Wikipedia
Code:
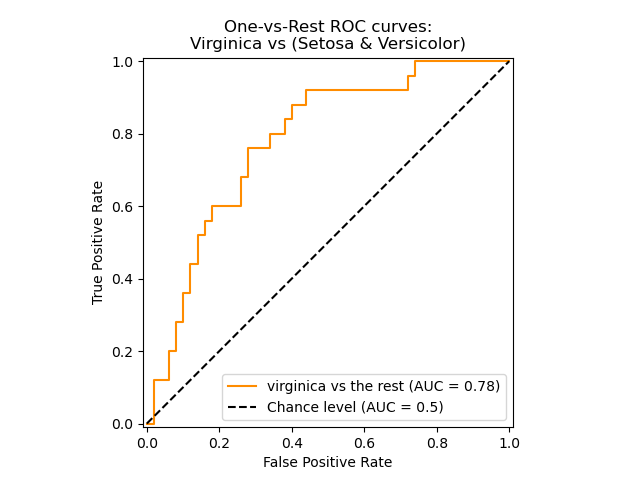
The ROC curve (receiver operating characteristic curve) is a graph that illustrates the performance of a classification model as its discrimination threshold is varied. The ROC curve is created by plotting the true positive rate (TPR) against the false positive rate (FPR) at various threshold settings.
True Positive Rate (TPR):
False Positive Rate (FPR):
Resources:
- Receiver operating characteristic Wikipedia
- Receiver operating characteristic (ROC)
- Classification: ROC Curve and AUC
- Understanding AUC - ROC Curve
AUC stands for "Area under the ROC Curve". AUC provides an aggregate measure of performance across all possible classification thresholds. One way of interpreting AUC is as the probability that the model ranks a random positive example more highly than a random negative example. - Google Developers Machine Learning Crash Course
Resources:
- Area under the curve Wikipedia
- Receiver operating characteristic (ROC)
- Classification: ROC Curve and AUC
- Understanding AUC - ROC Curve
Hinge loss is a loss function usef for "maximum-margin" classification, most notably for Support Vector Machines (SVMs).
Resources:
Code:
The Kullback-Leibler divergence, , often shortenend to just KL divergence, is a measure of how one probability distribution is different from a second, reference porbability distribution.
Resources:
Code:
The Brier Score is a strictly proper score function or strictly proper scoring rule that measures the accuracy of probabilistic predictions. For unidimensional predictions, it is strictly equivalent to the mean squared error as applied to predicted probabilities. - Wikipedia
Resources:
- Brier Score Wikipedia
- Brier Score Loss Scikit-Learn
- Brier Score – How to measure accuracy of probablistic predictions
Code:
The mean squared error (MSE) or mean squared deviation (MSD) measure the average of the squares of the errors - that is, the average squared differences between the estimated and actual values.
Resources:
- Mean squared error Wikipedia
- Mean squared error Scikit-Learn
- Machine learning: an introduction to mean squared error and regression lines
Code:
Mean Squared Logarithmic Error (MSLE) is an extension of Mean Squared Error (MSE) often used when the target has an exponential growth.
Note: This metrics penalizes under-predictions greater than over-predictions.
Code:
Resources:
- Mean squared logarithmic error (MSLE)
- Mean squared logaritmic error Scikit-Learn
- Understanding the metric: RMSLE
The mean absolute error (MAE) measure the average of the absolute values of the errors - that is, the average absolute differences between the estimated and actual values.
Code:
Resources:
Mean absolute percentage error is an extension of the mean absolute error (MAE) that divides the difference between the predicted value and the actual value
by the actual value. The main idea of MAPD is to be sensitive to relative errors. It's for example not changed by a global scaling of the target variable.
Code:
Resources:
The median absolute error also often called median absolute deviation (MAD) is metric that is particularly robust to outliers. The loss is calculated by taking the median of all absolute differences between the target and the prediction.
Code:
Resources:
Cosine similarity is a measure of similarity between two vectors. The cosine similarity is the cosine of the angle between two vectors.
Code:
Resources:
- Cosine Similarity Wikipedia
- Cosine Similarity – Understanding the math and how it works (with python codes)
The coefficient of determination, denoted as is the proportion of the variation in the dependent variable that has been explained by the independent variables in the model.
Code:
Resources:
The Tweedie distributions are a family of probability distributions, which include he purely continuous normal, gamma and Inverse Gaussian distributions and more.
The unit deviance of a reproductive Tweedie distribution is given by:
Code:
Resources:
The
-Score computes the percentage of deviance explained. It is a generalization of
, where the squared error is replaced by the Tweedie deviance. - Scikit Learn
, also known as McFadden’s likelihood ratio index, is calculated as
Code:
Resources:
Huber loss is a loss function that is often used in robust regression. The function is quadratich for small values of and linear for large values.
where and
is the point where the loss changes from a quadratic to linear.
Code:
Resources:
Logarithm of the hyperbolic cosine of the prediction error.
Code:
Resources:


