This repo includes diverse works related to performance issues. We divide these works into two categories:
- Semantics-based ISSRE2019
- Fast-path
- Arguments
- Cache memorization
- Data Access
- Synchronization
- Syntactic-based PLDI 2012
- Uncoordinated functions
- Skippable Function
- Synchronization Issues
- Configuration-related
- CP-Detector, ASE 2020, semantics based
- Optimization on-off
- Non-functional tradeoff
- Resource allocation
- Functionality on-off
- LearnConf, EuroSys 2020, program dependency based
- Data Dependency
- Control Dependency
- If-related
- Loop-related
- CP-Detector, ASE 2020, semantics based
- Specific performance issues
- How performance bugs are exposed, introduced, fixed(patch)
- Bug fix time, Number of changed lines
- Program analysis, including static analysis and dynamic analysis, such as profiler and instrumentation
- L-Doctor ICSE 2017
- Static-dynamic hybrid analysis to provide accurate performance diagnosis
- JXPerf FSE 2019
- Inefficiency Profiler
- Use PMU and debug registers to recognize some wasteful memory accesses
- Prior works mainly use bytecode instrumentation with high overhead
- LearnConf, EuroSys 2020
- Leverage static analysis to infer performance properties of software configs
- LoadSpy, ICSE, 2019
- Propose a whole-program fine-grained profiler to pinpoint redundant loads
- L-Doctor ICSE 2017
- Statistical learning
- Deep Learning
- SPLASH Companion 2020
- AST with data dependency edge + graph embedding(Deep Walk)
- SPLASH Companion 2020
- design a root-cause and fix-strategy taxonomy for inefficient loops
- design a static-dynamic hybrid analysis tool, LDoctor, to provide accurate performance diagnosis for loops
- LDoctor can automatically judge whether the symptom is caused by inefficient loops and provide detailed root-cause information that helps understand and fix inefficient loops
- Three requirements
- Coverage, covering a big portion of real-world inefficient loop problems
- Actionability, each root-cause category being informative enough to help developers fix a performance problem
- Generality, allowing automated diagnosis to be applied to many applications
- Two categories
- Resultless: spend a lot of time in computation that does not produce results useful after the loop, contain four sub-types
- 0*: never produce any results in any iteration. They are rare in mature software systems and should be deleted.
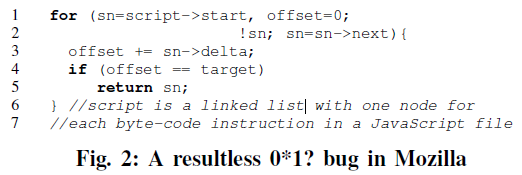
- 0*1?: only produce results in the last iteration
- 1*: This category always generate results in almost all iterations.
- They are inefficient because their results are useless due to high-level semantic reasons.
- For example, several Mozilla performance problems are caused by loops that contain intensive GUI operations whose graphical outcome may not be observed by humans and hence can be optimized
- Fix strategies for these loops likely vary from case to case and are difficult to automate
- Redundancy: when a large amount of computation produces already-available results
- Cross-iteration Redundancy: one iteration repeats what was already done by an earlier iteration of the same loop
- Cross-loop Redundancy: one dynamic instance of a loop spends a big chunk, if not all, of its computation in repeating the work already done by an earlier instance of the same loop
char* sss_xph_generate(node_t* aNode) {
    int count=0;
    for (n = aNode; n ; n = aNode->prev)
        if (n->localName == aNode->localName && n->namespaceURI == aNode->namespaceURI)
            count++;
    ...
} //called for every node in a list
- Resultless: spend a lot of time in computation that does not produce results useful after the loop, contain four sub-types
- Three principles
- symptom oriented.
- static–dynamic hybrid
- sampling
This paper focuses on redundant loads. The redundant loads can be classified into two categories:
-
Temporal Load Redundancy
- A memory load operation L2, loading value V2 from location M, is redundant iff the previous load operation L1, performed on M, loaded a value V1 and V1 = V2. If V1 ≈ V2, we call it approximate temporal load redundancy.
-
Spatial Load Redundancy A memory load operation L2, loading a value V2 from location M2, is redundant iff the previous load operation L1, performed on location M1, loaded a value V1 and V1 = V2, and M1 and M2 belong to the address span of the same data object. If V1 ≈ V2, we call it approximate spatial load redundancy.
It also proposes a definition Redundancy Fraction: the ratio of bytes redundantly loaded to the total bytes loaded in the entire execution. Large redundancy fraction in the execution profile of a program is a symptom of some kind of software inefficiency.
The causes of redundant loads can be classified into 3 provenances:
-
Input-sensitive Redundant Loads The following list is a case from backprop, a supervised learning algorithm. As the training progresses, many weights can be stabilized and delta[j] and oldw[k][j] are zeros. So, the computations can be bypassed.
for (j = 1; j <= ndelta; j++) {
    for (k = 0; k <= nly; k++) {
        new_dw = ((ETA*delta[j]*ly[k])+(MOMENTUM*oldw[k][j]));
        w[k][j] += new_dw;
        oldw[k][j] = new_dw;
    }
}
-
Redundant Loads due to Suboptimal Data Structures and Algorithms
-
Redundant Loads due to Missing Compiler Optimizations
This paper leverages PMU and hardware debug register to detect wasteful memory access:
- Dead store<S1, S2>
- S1 and S2 are two successive memory stores to location M (S1 occurs before S2)
- S1 is a dead store iff there are no intervening memory loads from M between S1 and S2.
- Silent store<S1, S2>
- A memory store S2, storing a valueV2 to location M, is a silent store iff the previous memory store S1 performed on M stored a value V1, and V1 = V2.
- Silent load<L1, L2>
- A memory load L2, loading a value V2 from location M is a silent load iff the previous memory load L1 performed on M loaded a value V1, and V1 = V2.
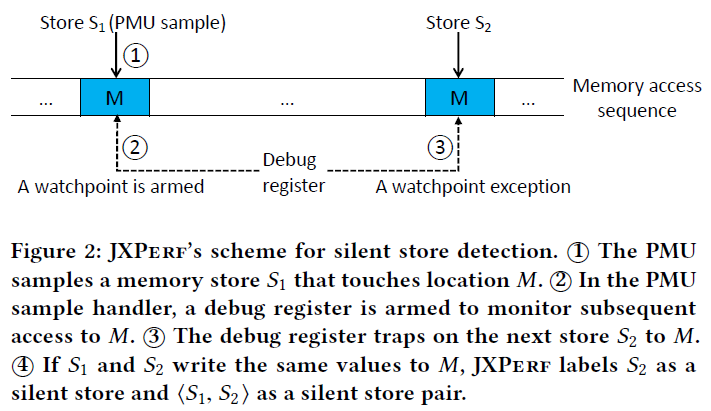
The methodology can be described as the following figure(Silent Store):
- PMU samples a memory store
- Debug register monitor
- Debug register trap
- Check value
This work may be the first one to leverage deep learning to recognize performance bugs. It uses ML to infer inefficient statements in code. The approach is easy:
- Leverage AST to capture the control flow of corresponding program;
- Add data dependency edges to capture data flow
- Perform BFS search on the AST
- Find Store or Param node
- Create a stable entry in a dict with the node's value(define)
- Find Load node
- Create a data dependency edge from its parent store or param node to load node
- Use DeepWalk to embedd the AST and it seems that efficient and inefficient ASTs are seperated:
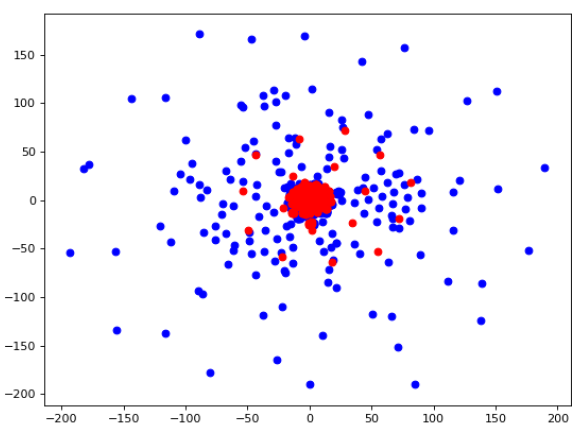
So, the author argued that constructing every statements' AST and graph embedding can help us classify efficient or inefficient statements;
This paper conducts a comprehensive study of 109 real-world performance bugs that are randomly sampled from five software suites. The important results are listed as two types below:
-
Root cause(Taxonomy)
- Uncoordinated Functions: inefficient function-call combinations composed of efficient individual functions.
- Skippable Function: call functions that conducts unnecessary work given the calling context
- Synchronization Issues: unnecessary synchronization that intensifies thread competition is also a common cause of performance loss

-
Rule-based detection
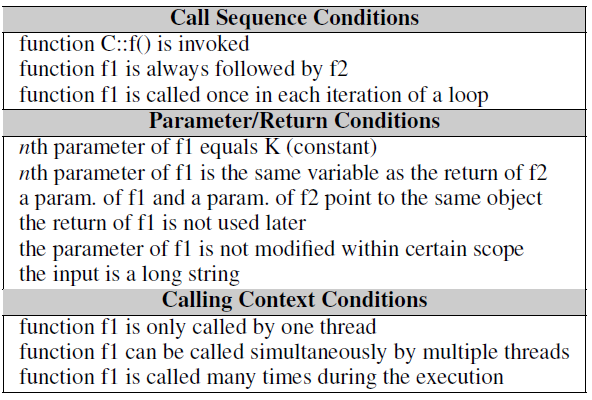
- Efficiency Rule contains two components: A transformation and a condition
- Once code region satisfies the condition, the transformation can be applied to improve performance.
- Concluded from patches(A total of 109)
- Efficiency Rule contains two components: A transformation and a condition
This paper leverages performance bug related commits to understand the ecosystem and provides a benchmark for the future work.
- Collect commits
- Selection: Top popular projects from Debian repo
- Identification: keywords-based, such as "performance" and "accelerate". All results will be manual checked
- Taxonomy: Semantics behind code changes, based on the observation proposed by authors: Perf bug fixing commits follow certain patterns
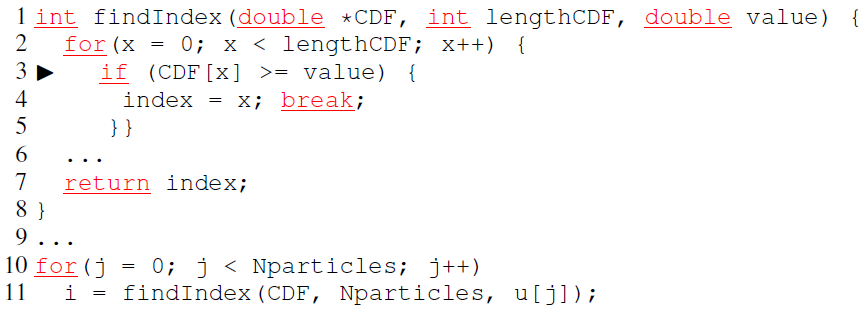
- Fast-path: avoid repeated or slow computation when possible, apply a different algorithm to achieve the same result as the slow-path
int foo(int bar) {
    if (some_cond(bar)) {
        return fast_path; // Fast-path
    }
    return very_heavy_computation(bar); //Slow-path
}
- Arguments: some commits change the values of arguments passed to a function so that the control flow can take an existing fastpath in that function
- Cache Memoization: The result of a computation should be stored if it is needed onward to avoid redundant re-computations of the same result
Actually, strlen(str) can be removed from this for statement by loop invariant analysis;
for(char *c = str; c - str < strlen(str); c++) {}
- Data Access: Different data structures yield different data access overheads, e.g., retrieving unsorted data without an index in a vector or list requires a linear search, while accessing data from hashed maps only introduces the overhead of hash functions.
- Synchronization: improperly serialized program parts can become performance bottlenecks
- C/C++ Project: Mutex-like lock, OS kernel: Spinlock
- sync related performance problems are relatively infrequent compared to other
- developers nowadays tend to minimize the amount of shared data to avoid race conditions
- Fast-path: avoid repeated or slow computation when possible, apply a different algorithm to achieve the same result as the slow-path
This paper proposes static analysis based approach to discovering performance properties of system configurations. The key insight is that any configuration that affects performance dynamically must have a data/control flow dependency with certain time or space intensive operations(Performance Operations or PerfOps).
It provides a taxonomy of how a config might affect performance through program dependency. The taxonomy proposed contains three categories demonstrated by the following toy examples: C is a Variable derived from Config
- A data dependence between the PerfConf and a PerfOp parameter;
new byte[C];
- An if-related control dependence where the PerfConf helps determine whether the PerfOp is executed;
if(C <= tag) {
    new byte[a];
} else {
    new byte[b];
}
- A loop-related control dependence where the Perf-Conf controls the number or frequency of PerfOp executions.
for(int i = 0; i < N; i += C) {
    ...
}
Workflow:
- Identify PerfConfs and PerfOps
- PerfConfs: identifies all the invocations of configurationloading APIs
- PerfOps
- What are PerfOps?(likely to have large performance impacts at run time)
- Memory operations: two types of operations related to arrays
- a heap or static array allocation instruction that allocates an array with a non-constant array length
- a container-add operation that adds the reference of an array
- Latency operations
- cause a thread to pause, including Thread::sleep() and all lock-synchronization APIs
- Java I/O-library operations
- operations that directly affect the parallelism level of the system, including new Thread(), new ThreadPoolExecutor()
- configurable and expensive operations in distributed systems, currently only includes heartbeat() function
- Memory operations: two types of operations related to arrays
- What are PerfOps?(likely to have large performance impacts at run time)
- Performance-related configs
- Analyze whether any PerfOp has data or control dependency upon any configuration variable
- Identify PerfConf patterns(About performance-related configs)
This paper firstly conducts an empirical study to confirm the feasibility of detecting perf bug based on statistical learning.
Statistical debugging collects program predicates, such as whether a branch is taken, during both success runs and failure runs, and then uses statistical models to automatically identify predicates that are most correlated with a failure, referred to as failure predictors.
- Most perf bug commits provide input generation methodology.
- Branches: which branch is taken
- Returns: function return point, tracking <0, <=0, >0, >=0, =0, !=0
- Scalar-pairs: each pair of variable x and y, tracking x < y, x <= y, x > y, x >= y, x = y, x != y
- Instructions: whether executed
- a basic model proposed by CBI work
- ΔLDA
-
Optimization on-off: a configuration option is used to control an optimization strategy
- MYSQL-67432
SELECT * FROM t WHERE c1<100 AND (c2<100 OR c3<100)
- MySQL can speed up at least 10% by enabling the optimization strategy index_merge=ON
- MYSQL-67432
-
Non-functional tradeoff: a configuration option is used to achieve the balance between performance and other non-functional requirements of the program
- GCC uses O0, O1, O2, O3 options to control the balance between compilation time and binary execution efficiency. A higher O level indicates more compilation time.
- GCC-17520: switching from O0 to O2 increases the compilation time from less than 1 second to 1 minute, the root cause is a bug in branch prediction algorithm
-
Resource allocation: a configuration option is used to control resource usages (e.g., RAM, CPU cores)
-
Functionality on-off: a configuration option is used to control a non-performance functionality but indirectly influences the system’s performance
- MariaDB-5802: log_slave_updates=on -> off
