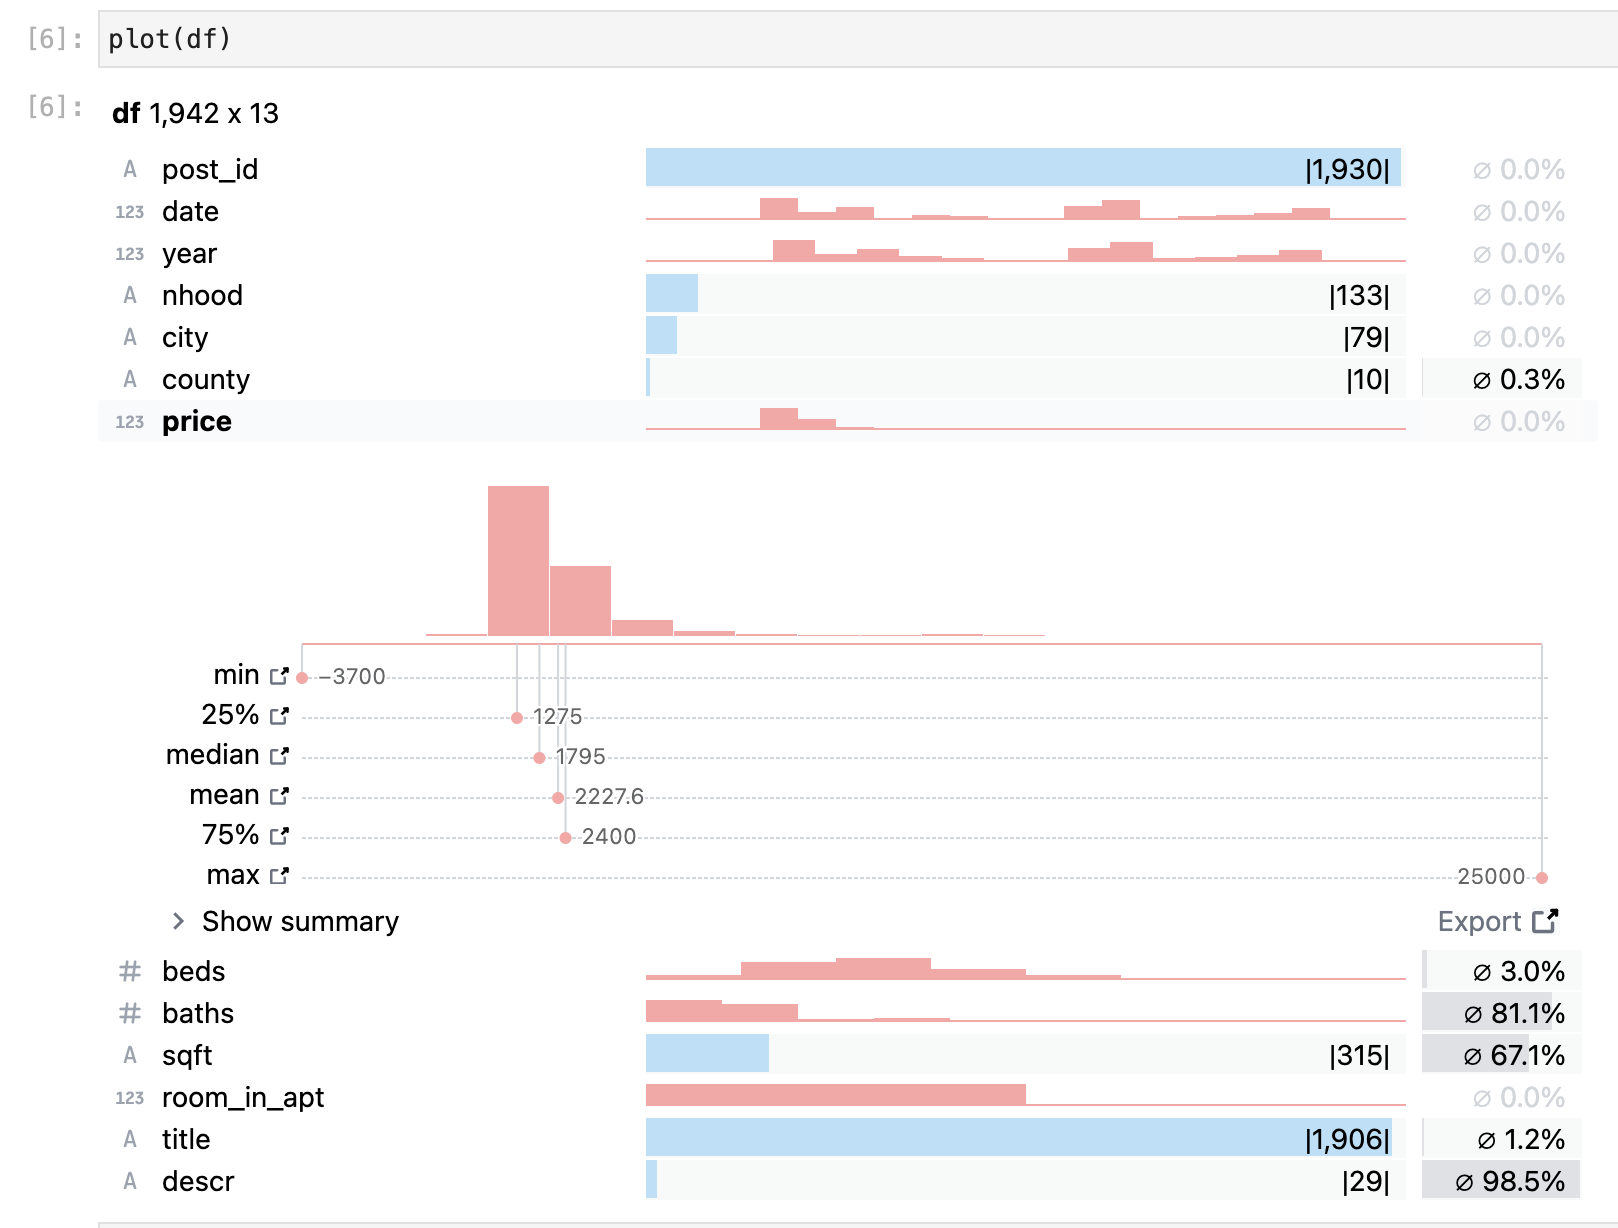
Inline data profiles to help you understand your data with one function.
Check out AutoProfiler for a version that updates automatically when you change your data.
You can install using pip:
pip install diginlineprofilerImport in a Jupyter notebook or lab then pass in any pandas dataframe.
from diginlineprofiler import Visualizer as plot # here we rename to plot but can be anything

# df must be a pandas dataframe!
plot(df)Create a dev environment:
conda create -n diginlineprofiler-dev -c conda-forge nodejs yarn python jupyterlab jupyter-packaging
conda activate diginlineprofiler-dev
Install the python. This will also build the TS package.
pip install -e .When developing your extensions, you need to manually enable your extensions with the notebook / lab frontend. For lab, this is done by the command:
jupyter labextension develop --overwrite .
npm run build
If you use JupyterLab to develop then you can watch the source directory and run JupyterLab at the same time in different terminals to watch for changes in the extension's source and automatically rebuild the widget.
# Watch the source directory in one terminal, automatically rebuilding when needed
npm run watch
# Run JupyterLab in another terminal
jupyter lab
After a change wait for the build to finish and then refresh your browser and the changes should take effect.
If you make a change to the python code then you will need to restart the notebook kernel to have it take effect.
