How to start | Key features | License | Useful links | Other examples | Join our online community
The DHTMLX JavaScript Diagram library allows developers to create interactive, customizable diagrams such as flowcharts, organizational charts, network diagrams, mind maps, etc. It simplifies complex data visualization by organizing it into a clear hierarchical structure using automatic layouts and live editors.
Clone the repository or download files.
yarn
yarn start
or
npm install
npm run start
You can also use GitHub Codespaces to run online.
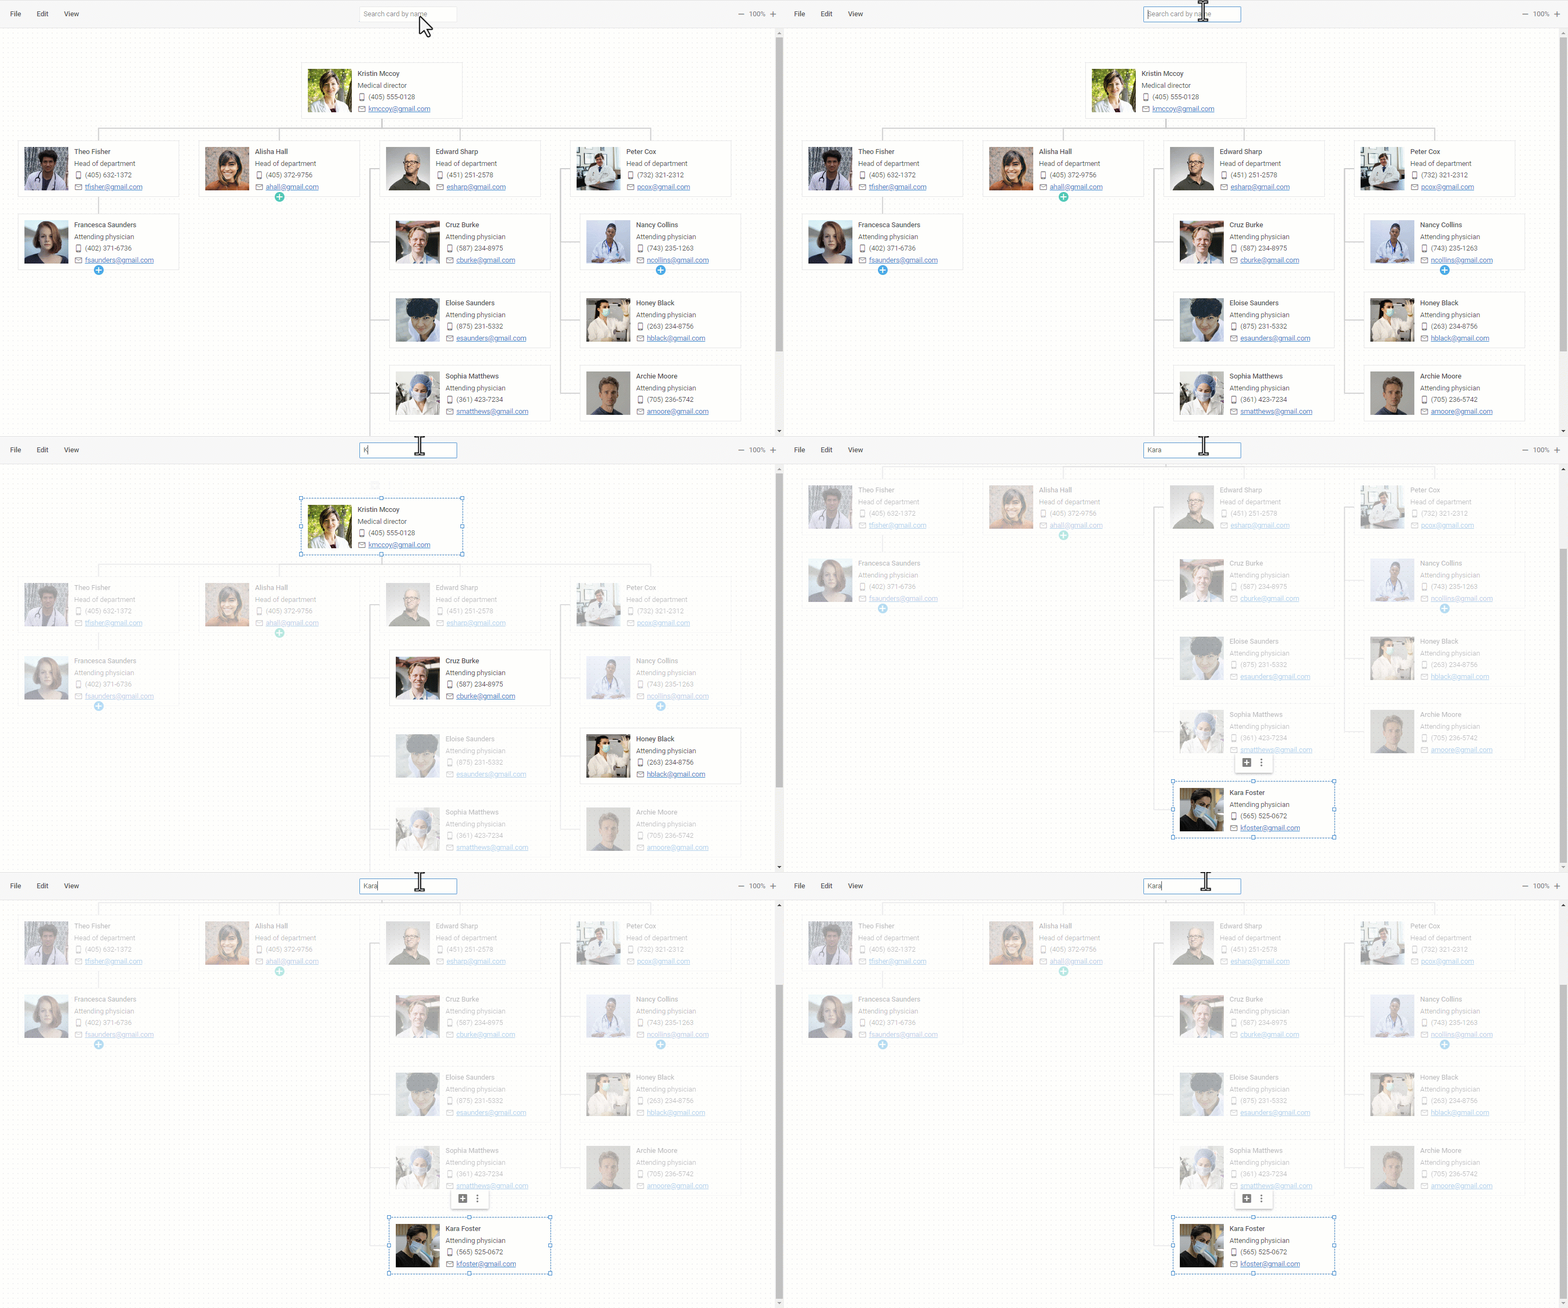
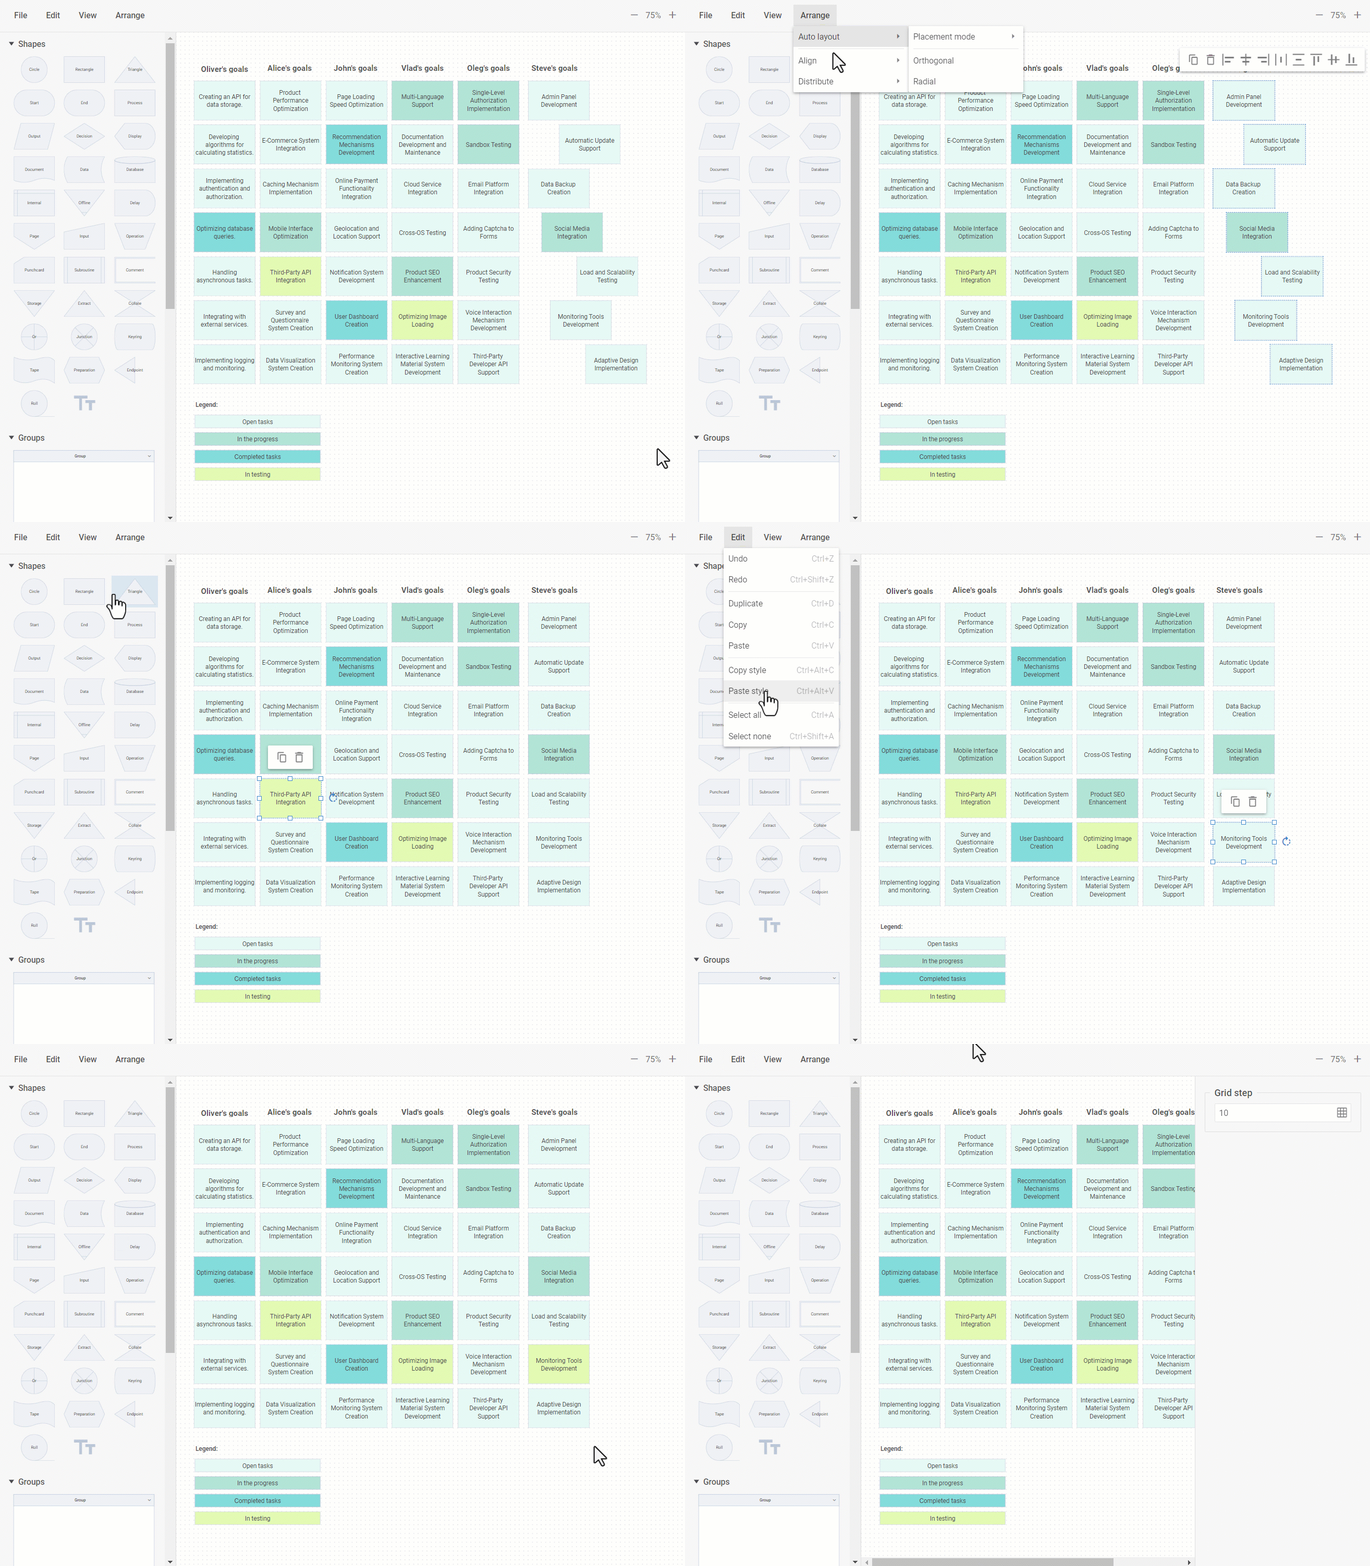
- Live Diagram, Org chart, and Mindmap editors for a quick diagram arrangement
- Orthogonal and Radial auto layout modes
- Adding partner and assistant shapes
- Searching and filtering
- Creating swimlanes and groups
- Expanding and collapsing branches
- Creating custom shapes
- Group work with multiple objects (select, copy, move, delete)
- Intuitive drag-n-drop behavior
- Snap lines
- Configurable Toolbar, Shapebar, and Editbar elements
- Built-in themes
- Inline editing
- Touch support
- Keyboard navigation
- Cross-browser support
- Export to PDF and PNG
This demo is available under the Evaluation license. To use it in your projects, please choose a proper license on the DHTMLX website: https://dhtmlx.com/docs/products/licenses.shtml
Check out examples of using DHTMLX Diagram with other technologies:
| JavaScript | Angular | React |
|---|---|---|
 |
 |
 |


